XRP Hits Uncharted Territory: Monthly RSI Plummets to Historic Lows
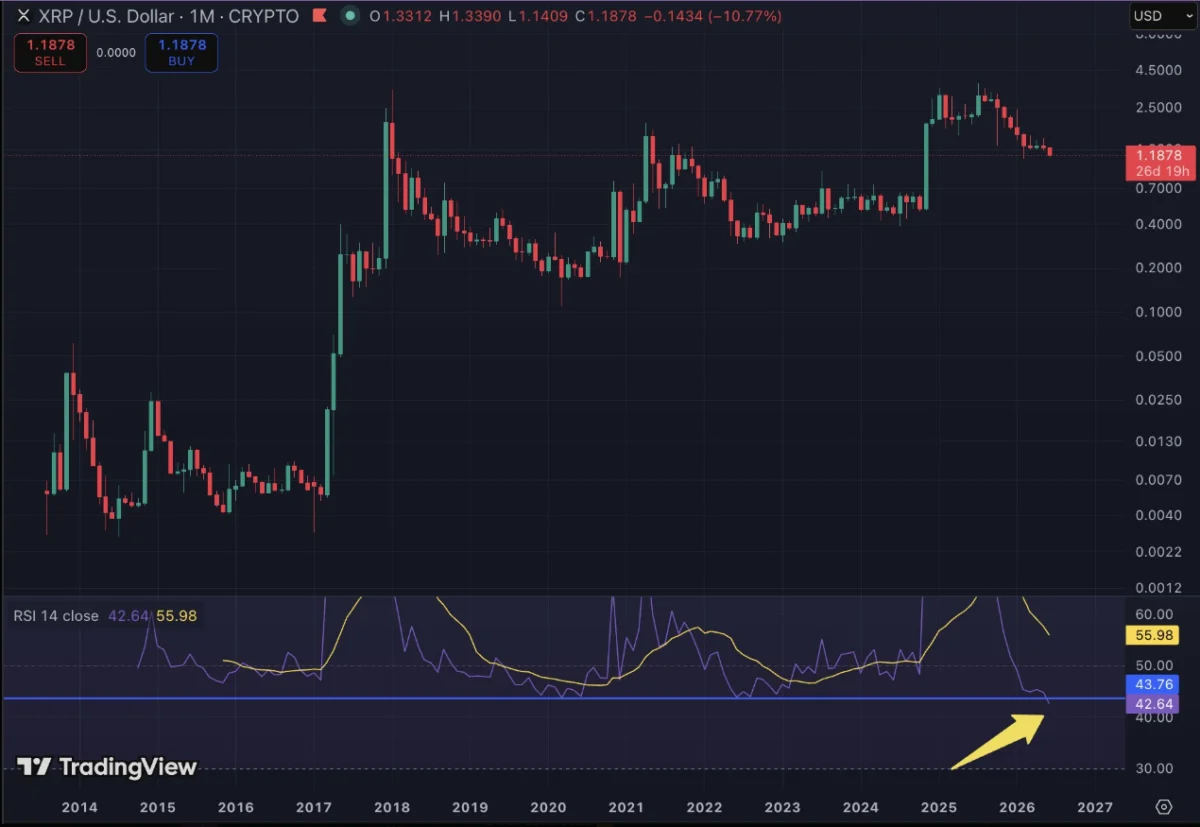
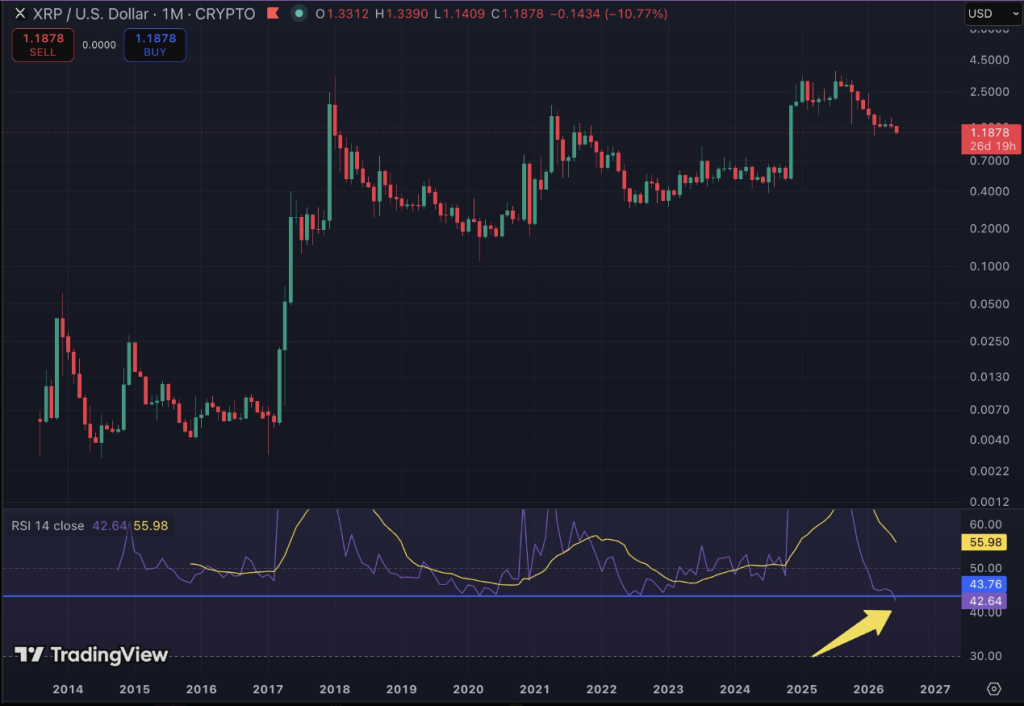
In the volatile landscape of digital assets, technical indicators often serve as the lighthouse by which traders navigate turbulent waters. Currently, XRP is flashing a signal that has captured the attention of market analysts and institutional observers alike. The monthly Relative Strength Index (RSI) for XRP has descended to 41.64, marking the lowest reading ever recorded for the token. This figure eclipses the previous historic low of 43.75, set in March 2020—a period defined by the “Black Thursday” market crash that saw XRP bottom out at a mere $0.11 during one of the most punishing bear markets in cryptocurrency history.
The Technical Breakdown: Understanding the RSI
The Relative Strength Index is a momentum oscillator used to measure the speed and change of price movements. Traditionally, an RSI reading below 30 is viewed as "oversold," suggesting that an asset may be undervalued and due for a potential trend reversal. While XRP’s current reading of 41.64 has not yet breached the classic 30-level threshold, its significance lies in its relative context. For a token with such a long history in the market, reaching a new all-time low in monthly momentum is a rare event that suggests the selling pressure has been sustained and profound.
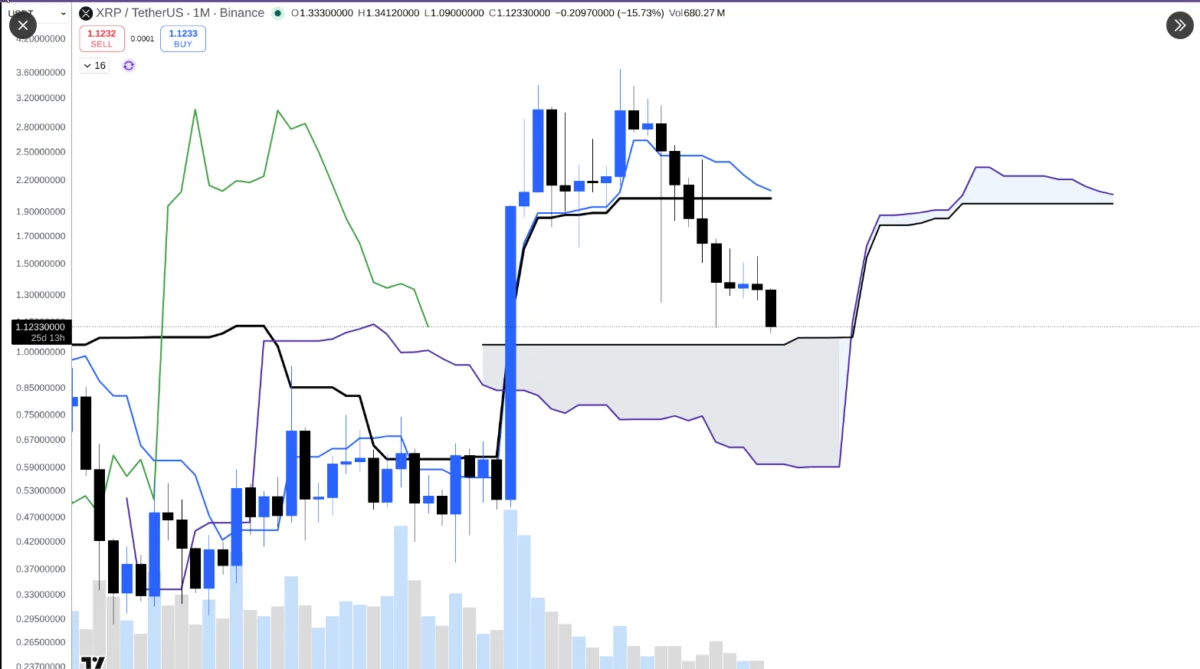
The downward trend has been steep. At the time of this writing, XRP is trading in the vicinity of $1.11, representing a staggering 61% decline from its October 2025 peak of $2.84. This multi-month stagnation has frustrated long-term holders, as the token has failed to mount a meaningful recovery despite various attempts to consolidate support levels.
Chronology of the Current Downturn
To understand the gravity of the current situation, one must look at the timeline of the recent decline. The alert was first sounded by prominent XRP community commentator Austin, who highlighted the anomaly on social media. Initially observing a reading of 42.64 as the token slid to $1.18, Austin’s warning proved prescient as the price continued to bleed, dragging the monthly RSI down to its current level of 41.62–41.64.
- October 2025: XRP reaches a local high of $2.84, buoyed by market optimism.
- Late 2025 – Early 2026: A period of persistent distribution begins, marked by lower highs and lower lows.
- Early June 2026: XRP revisits price levels not seen since February, triggering the historic RSI breach.
- Present: The market grapples with the implications of the record-low momentum as the June monthly candle remains open.
A Signal With A Crucial Caveat
While the data paints a grim picture, technical analysts are quick to provide a vital disclaimer: the month of June is not yet closed. In technical analysis, the monthly RSI is determined by the closing price of the monthly candle. Should XRP experience a sharp rebound—specifically, if it recovers to levels above $1.30 before the month concludes—the RSI would recalibrate significantly higher.
This possibility underscores the "wait-and-see" approach currently adopted by many institutional traders. If the token fails to rally, the record-low RSI will be etched into the permanent historical record of the asset. However, if the month closes with a bullish surge, the current alarm may prove to be a "false signal," potentially indicating a bear trap rather than a fundamental collapse of momentum.

Supporting Data: Broader Market Context
XRP does not exist in a vacuum, and its recent struggles are mirrored by a broader cooling in the digital asset sector. This week alone, the total cryptocurrency market capitalization shed approximately $330 billion. The sell-off was exacerbated by news involving Strategy, the firm associated with Michael Saylor, which confirmed the sale of 32 BTC from its massive treasury. While the amount sold was negligible compared to the firm’s total holdings of over 800,000 BTC, the market reacted with heightened sensitivity, pushing Bitcoin toward the $63,000 mark.
The ripple effect on XRP was pronounced. The token’s market capitalization evaporated from $82.5 billion at the start of the week to roughly $69 billion—a decline of approximately 15% in just a few days. This rapid devaluation has left many market participants questioning whether the current price of $1.10 serves as a robust support floor or a gateway to further losses.
Historical Precedents: The 2020 Comparison
History rarely repeats itself exactly, but it often rhymes. The 2020 episode remains the most critical point of comparison for current XRP investors. In that year, the RSI bottom aligned perfectly with the price floor of the cycle. Following that bottom, XRP initiated a series of higher lows, eventually climbing to $1.96 by April 2021.
More recently, the November 2024 surge saw XRP reach $3.40, a remarkable 580% gain from the October lows of that same year. For proponents of the asset, this history provides a glimmer of hope. It suggests that while the current RSI reading indicates extreme oversold conditions, these periods have historically served as the "springboard" for massive rallies in the subsequent months and years.
Institutional and Market Implications
The implications of this RSI signal are far-reaching. For institutional investors, a reading this low often triggers algorithmic "buy" signals, as the risk-to-reward ratio begins to tilt in favor of the bulls. Conversely, for retail traders, the signal can induce panic, leading to further capitulation.
Furthermore, the state of the XRP ledger and the ongoing regulatory environment play a role in market sentiment. While the price action is currently dominated by technical factors, fundamental developments—such as shifts in cross-border payment volumes and the adoption of the XRP Ledger by financial institutions—remain the underlying bedrock. Whether the current RSI low acts as a final capitulation point or the beginning of a prolonged stagnation period depends heavily on whether institutional buying pressure can absorb the current wave of retail selling.
Expert Commentary and Market Sentiment
Market observers are divided on the interpretation of the current charts. Some suggest that the RSI has lost its predictive power in a market increasingly driven by macroeconomic interest rate decisions and geopolitical uncertainty. Others, like Austin, argue that the RSI is a pure reflection of market exhaustion. When a high-liquidity asset like XRP hits a record-low momentum indicator, it typically suggests that the "weak hands" have exited the market, leaving the supply concentrated in the hands of long-term holders.
However, the risk remains. If the $1.10 level fails to hold, technical analysts warn that there is little historical "price memory" below the $1.00 psychological barrier, which could lead to accelerated volatility.
Conclusion: The Road Ahead
As we look toward the end of June, all eyes remain fixed on the monthly closing price. The current RSI of 41.64 is a stark reminder of the volatility inherent in the cryptocurrency space. Whether this serves as a historic buying opportunity or a warning sign of further downward movement, the data confirms that XRP is currently at a critical juncture.
For the XRP community, the hope remains that the current period will mirror the recovery seen in 2020 and 2024. Yet, until the monthly candle closes and the price stabilizes, the market remains in a state of high alert. Investors are advised to monitor the $1.30 resistance level, as that threshold holds the key to invalidating the bearish signal and potentially resetting the momentum of one of the market’s most resilient digital assets.
Disclaimer: This article is for informational purposes only and does not constitute financial advice. Cryptocurrency investments are subject to high market risk. Always conduct your own research before making investment decisions.