
Ethereum at a Crossroads: Analyzing the Historic RSI Collapse and Future Market Trajectory
The cryptocurrency market is currently navigating a period of profound turbulence, with Ethereum (ETH)—the industry’s second-largest digital asset—finding itself at the epicenter of a bearish correction. As of June 2026, Ethereum has breached critical support levels, falling below the $1,800 psychological threshold. This downturn, which saw the asset dip as low as $1,536 in recent trading sessions, has sent shockwaves through the investor community. However, beneath the immediate pain of price depreciation lies a technical anomaly that has captured the attention of veteran analysts: the monthly Relative Strength Index (RSI) has hit its lowest level since Ethereum’s inception in 2015.
Main Facts: The Anatomy of the June Crash
The current market climate is characterized by pervasive risk aversion. After reaching a historic peak of $4,946 in August 2025, Ethereum has endured nine grueling months of downward pressure. The breakdown below $1,800 is not merely a superficial dip; it represents a significant shift in market structure that forces investors to reassess the long-term viability of current support zones.
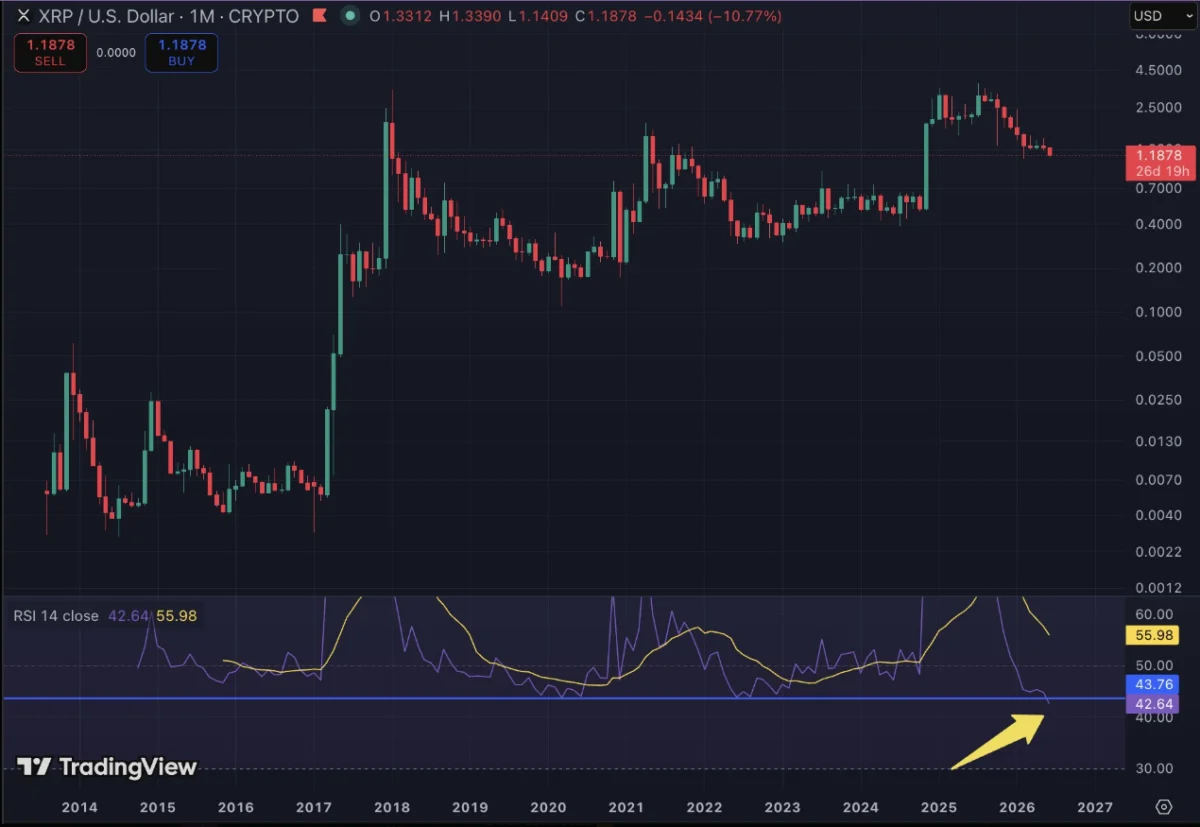
The most striking development is the state of the monthly RSI. Typically used to identify overbought or oversold conditions, the RSI has plummeted to approximately 40. This is a historic low for the asset, surpassing the readings observed during previous market capitulations. For many technical analysts, this figure is not just a warning sign—it is a signal that the market may be reaching an extreme level of exhaustion. When an asset reaches such an oversold state on a monthly timeframe, it often indicates that the "weak hands" have exited the market, potentially setting the stage for a regime change.
A Chronology of Ethereum’s Bearish Cycle
To understand the severity of the current situation, one must look at the historical timeline of Ethereum’s market cycles.
- The 2017 Peak: Ethereum established its first major cycle top, creating a blueprint for the volatility that would follow in subsequent years.
- The 2020 Reset: During the pandemic-induced market chaos, Ethereum’s RSI reached deep, depressed levels. This served as the precursor to a massive rally, moving from a low of approximately $88 to an eventual 2021 peak exceeding $4,800.
- The 2022 Capitulation: Following the 2021 highs, Ethereum entered a protracted winter. The RSI once again reset to levels that many deemed "too low," yet this proved to be the base for the subsequent climb to the 2025 all-time highs.
- The 2025-2026 Downtrend: Since the August 2025 peak of $4,946, Ethereum has been locked in a downward channel. The June 2026 breach of $1,800 marks the culmination of this nine-month consolidation, leaving the asset at its lowest point in the current calendar year.
Supporting Data: Institutional Flows and Technical Indicators
While technical indicators provide a roadmap of sentiment, institutional capital flows provide the "fuel" for price action. The performance of Spot Ethereum ETFs has been a focal point for market observers throughout this volatility.

The ETF landscape has been defined by inconsistency. In early June 2026, the market witnessed a glimmer of hope when Spot Ethereum ETFs broke a 17-day streak of net outflows, recording $19 million in net inflows on Thursday, June 4. This provided a temporary morale boost to bulls who had been struggling to defend the $1,600 support level. However, the optimism proved fleeting. By Friday, June 5, the trend reversed, with the funds registering $5.97 million in net outflows.
This back-and-forth movement suggests that institutional investors remain hesitant, awaiting a clearer macroeconomic signal before committing large-scale capital to Ethereum. The conflict between the "oversold" technical indicators and the "uncertain" institutional flows creates a complex environment for traders.
Official Responses and Market Perspectives
Market experts and technical analysts are divided on whether this RSI crash is a precursor to a "V-shaped" recovery or a sign of deeper structural rot.
"The current RSI reading is unprecedented," says one prominent market strategist. "We are seeing the most extreme momentum reading in Ethereum’s history. While history is not a guarantee of future performance, these zones have historically marked the difference between a mid-cycle correction and the end of a bull run. We are currently firmly in the territory of the former."
Conversely, some analysts warn against "catching a falling knife." They argue that while the RSI suggests a bottom, the macroeconomic environment—marked by fluctuating interest rates and regulatory scrutiny—is vastly different from the 2020 and 2022 cycles. These voices urge caution, noting that without a sustained return of institutional capital, the RSI can remain depressed for longer than anticipated.
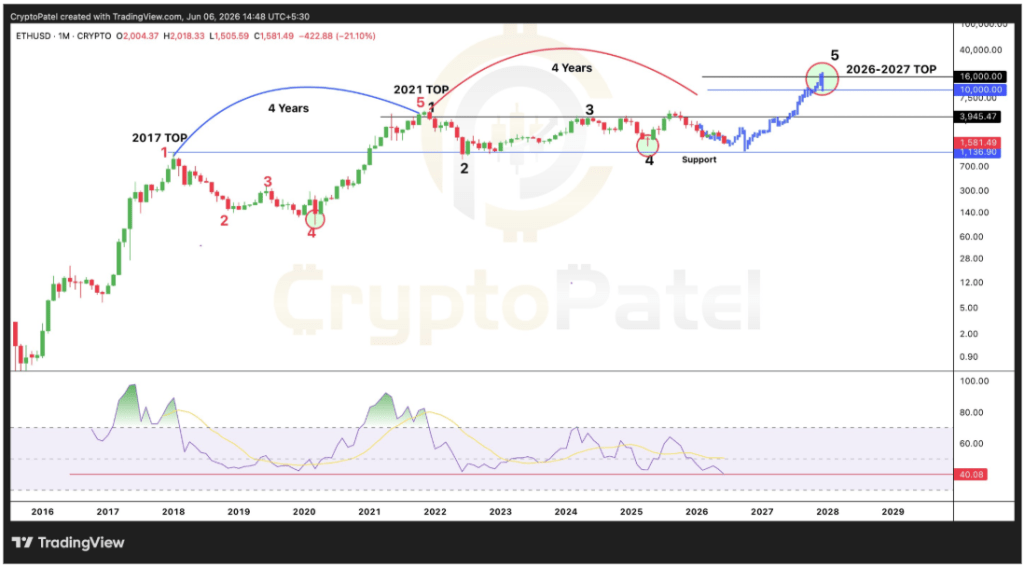
Implications: The $10,000 Horizon
Despite the current carnage, the long-term technical projections remain ambitious. Analysis of the monthly candlestick timeframe indicates that Ethereum is still traversing a classic four-year cycle. By mapping the distance between the 2017 top and the 2021 peak, some analysts are projecting a "Golden Triangle" trajectory that could see Ethereum reach a cycle high near $10,000 by 2027.
For this to manifest, Ethereum must successfully defend the $1,600 region. A failure to hold this support could trigger a secondary wave of liquidations, potentially pushing the price toward levels not seen since the early stages of the 2024 recovery.
Key Takeaways for Investors:
- Technical Divergence: The record-low RSI suggests that selling pressure is approaching a historic exhaustion point.
- Institutional Watch: The volatility in Spot ETF flows remains the primary indicator to watch for institutional confidence.
- Support Thresholds: The $1,600–$1,800 range is the current "battleground." Bulls require consistent inflows to prevent further downside slippage.
- The Long Game: If history repeats itself, the current extreme RSI levels may serve as the foundation for the next major leg up, with long-term targets remaining in the five-figure range.
Conclusion
The recent decline of Ethereum below $1,800 is a sobering reminder of the volatility inherent in the digital asset space. However, the data provided by the monthly RSI provides a counter-narrative to the prevailing gloom. By hitting levels not seen since 2015, Ethereum is currently in a zone that has, in every previous instance, been followed by a significant market reversal.
While the institutional appetite remains fickle and the macroeconomic backdrop is complex, the structural history of Ethereum points to a pattern of periodic cleansing. Whether the current market will follow the footsteps of 2020 and 2022 remains the defining question of the year. Investors are advised to monitor the $1,600 support line closely, as the actions of the next few weeks will likely determine whether the "Golden Triangle" projection remains a viable roadmap for the 2026-2027 cycle. As always, in the volatile world of cryptocurrency, vigilance is the only reliable strategy.