XRP Hits Historic RSI Lows: A Critical Juncture for the Ledger’s Native Token
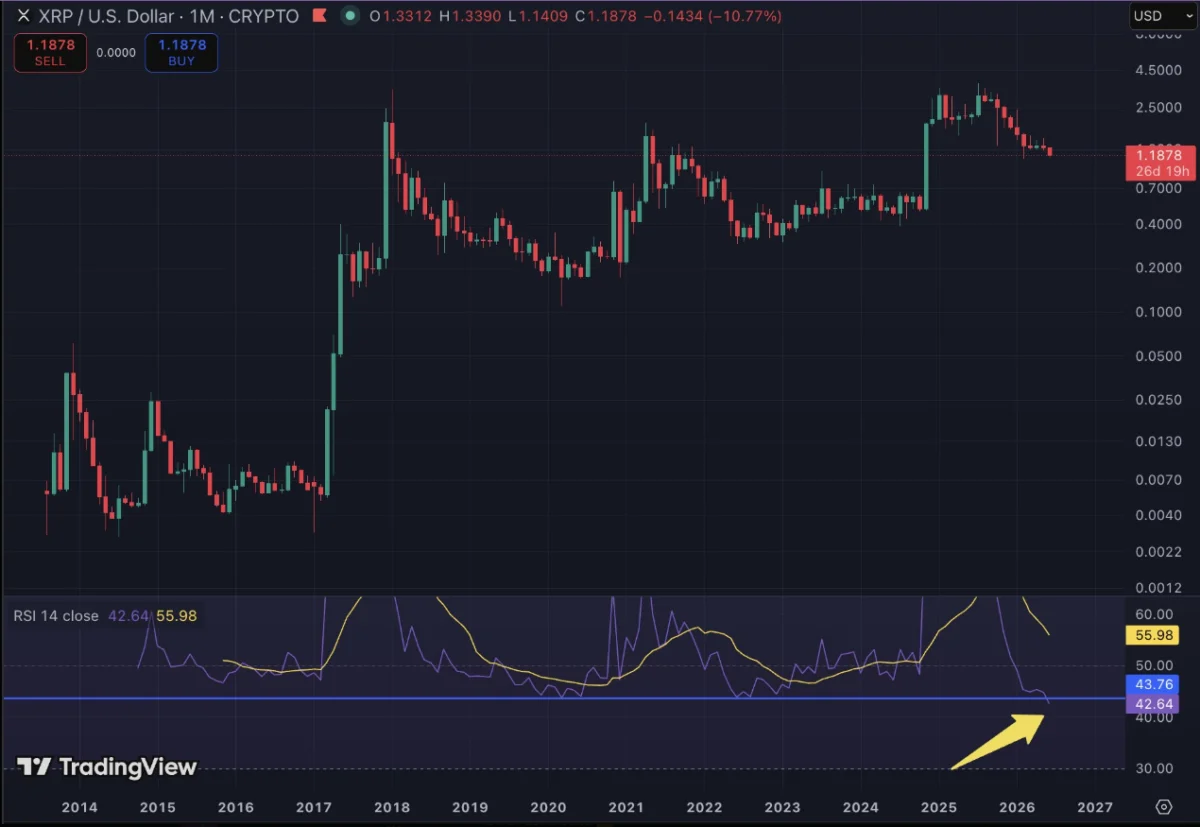
In the volatile landscape of digital assets, technical indicators often serve as the lighthouse by which traders navigate turbulent waters. This week, the XRP ledger’s native token, XRP, hit a grim milestone that has captured the attention of market analysts and long-term holders alike. The monthly Relative Strength Index (RSI)—a momentum oscillator used to measure the speed and change of price movements—has plummeted to 41.64. This figure marks the lowest monthly reading in the history of the token, surpassing even the dark days of March 2020, when XRP bottomed out at $0.11 during one of the most grueling bear markets in cryptocurrency history.
As the market grapples with this unprecedented technical signal, the broader implications for XRP’s future performance remain a subject of intense debate. Is this a signal of a structural collapse, or is it a historic "oversold" opportunity mirroring the cycles of the past?
A Signal With A Crucial Caveat
While the current RSI reading of 41.64 is objectively historic, market participants are advised to exercise caution before declaring this a definitive bottom. The most important factor in this analysis is the temporal nature of the data: June is still ongoing.
Technical indicators based on monthly candles only "finalize" once the month draws to a close. Financial analysts note that if XRP can mount a significant recovery—specifically, reclaiming levels above $1.30 before the end of the month—the RSI could reconcile and close significantly higher than its current reading. Such a move would effectively nullify the alarmist sentiment surrounding the current dip.
The initial alarm was raised by prominent XRP community commentator "Austin," who first flagged the RSI decline on X (formerly Twitter). At the time of his initial analysis, the RSI stood at 42.64 as XRP traded at $1.18. Since then, the continued slide in price to approximately $1.11 has pushed the indicator even lower. The token currently sits roughly 61% below its October 2025 peak of $2.84, a protracted decline that has frustrated investors who have seen little in the way of a meaningful, sustained recovery over the last eight months.
Chronology of a Correction
To understand where XRP is today, one must look at the timeline of its recent volatility. The decline did not happen in a vacuum; it is the culmination of a multi-month cooling-off period following the exuberant highs of late 2025.
- October 2025: XRP reaches a local high of $2.84, buoyed by market-wide optimism and specific developments within the XRP ecosystem.
- Late 2025 to Early 2026: The token enters a period of stagnant consolidation followed by a slow, agonizing bleed, as macro-economic pressures and shifting sentiment impact altcoins across the board.
- February 2026: Price levels currently being seen ($1.10) echo the support zones established back in early February, suggesting that the market is re-testing long-standing psychological floors.
- June 2026: The RSI hits its all-time low, sparking a heated debate regarding whether the asset has entered a "capitulation phase" or if further downside is imminent.
The decline has been exacerbated by a wider crypto-market sell-off. This week alone, the total cryptocurrency market capitalization shed approximately $330 billion. A notable catalyst for this broader downturn was the report that Strategy—a firm associated with Michael Saylor—sold 32 BTC from its massive treasury. While the amount sold was negligible compared to their total holdings of over 800,000 BTC, the market reacted with volatility, driving Bitcoin toward the $63,000 support level and dragging the entire altcoin sector, including XRP, down with it.

Supporting Data and Market Metrics
The mechanics of the RSI are vital to understanding why this specific reading is causing such concern. Typically, an RSI reading below 30 is defined as "oversold," suggesting that an asset has been beaten down too far and is likely due for a reversal. XRP’s current reading of 41.64 is not yet "technically" oversold by traditional definitions, yet it is historically significant because it represents the lowest level for this specific asset.
The divergence between the price and the RSI tells a story of declining momentum. As the price has drifted from $2.84 to $1.10, the "speed" of that downward move has been relentless, stripping the token of the support usually found at higher RSI levels.
Furthermore, the impact on market capitalization has been severe. At the start of the current week, XRP boasted a market cap of $82.5 billion. As of this writing, that figure has contracted to approximately $69 billion—a decline of roughly 15% in a matter of days. This rapid evaporation of value is characteristic of "weak hands" exiting positions, often a prerequisite for a true bottom to form in any financial market.
Historical Parallels: Lessons from 2020
History rarely repeats itself exactly, but it often rhymes. The 2020 episode serves as the primary benchmark for current XRP bulls. During that cycle, the RSI bottomed out at 43.75, which proved to be the absolute floor for the price of XRP at $0.11.
Following that 2020 low, the token entered a period of recovery characterized by a series of higher lows. By April 2021, the token had climbed to $1.96. The momentum continued into the next cycle, with a surge in November 2024 pushing the price as high as $3.40. Investors who held through the 2020 crash saw a gain of roughly 580% from the lows of that year.
Proponents of the "accumulation theory" argue that the current RSI reading is a signal to begin layering into positions, suggesting that the current macro-economic environment is simply a repeat of the 2020 fear cycle. However, critics point out that the regulatory and competitive landscape for XRP has changed drastically since 2020, and historical chart patterns alone may not be sufficient to predict a repeat of the 580% surge.
Implications for the XRP Ecosystem
What does this mean for the average investor? The implications are twofold.
1. The "Wait-and-See" Strategy:
Given that the June candle remains open, the most prudent course of action for institutional and retail traders is to wait for the monthly close. If the candle closes with an RSI near 41, it confirms that XRP is in a state of historical weakness. If the price recovers to $1.30 or higher, it suggests that the current dip was merely a "wick"—a temporary deviation—and that the underlying trend remains intact.
2. Increased Volatility and Risk Management:
The drop in XRP’s market cap to $69 billion highlights the liquidity risks currently facing the token. Traders should anticipate increased volatility as the market decides whether to defend the $1.00 psychological support level. Should that level fail to hold, the absence of strong historical support could lead to a swift move toward the sub-$0.90 range, where previous accumulation zones were located.
3. The Macro Context:
The correlation between XRP and the broader market (specifically Bitcoin and the movements of large institutional holders like Strategy) cannot be ignored. Even if XRP shows strength internally, its price action will likely continue to be tethered to the health of the broader crypto-asset market. Investors are watching for any signs of stabilization in Bitcoin as a proxy for when the altcoin market might find its footing.
Conclusion: A Defining Moment
The current RSI reading of 41.64 for XRP is a sobering reminder of the volatility inherent in the digital asset space. While technical indicators suggest that the token is under more pressure than it has ever been, they also highlight the potential for a massive historical pivot.
Whether this moment marks the beginning of a prolonged stagnation or the setup for a monumental recovery similar to the 2020-2021 cycle remains to be seen. For now, the crypto community remains glued to their charts, watching the June candle with bated breath. In the world of XRP, the next few weeks will likely define the narrative for the remainder of the year. As always, market participants are reminded that past performance—whether in 2020 or 2024—is not a guarantee of future results, and risk management must remain the priority during periods of historic technical anomalies.