
Ethereum’s Historic RSI Reset: A Ominous Warning or a Prelude to a $10,000 Rally?
The digital asset landscape is currently gripped by a wave of intense bearish sentiment, and at the epicenter of this market turbulence is Ethereum (ETH). As the world’s leading smart-contract platform, Ethereum’s recent price performance has sent shockwaves through the crypto ecosystem. Having plummeted below the critical $1,800 psychological support level, the asset is now navigating its most challenging period in recent memory. Beyond the raw price action, technical analysts are fixated on a rare, alarming, and potentially historic signal: the monthly Relative Strength Index (RSI) has cratered to its lowest level since the asset’s inception in 2015.
As Ethereum struggles to find a firm footing, investors and institutional stakeholders are left debating whether this exhaustion is a terminal signal for the current cycle or, as history might suggest, the "darkest hour" that precedes a parabolic reversal.
Main Facts: The Anatomy of the Crash
The decline of Ethereum has been systematic and unforgiving. After reaching a peak of $4,946 in August 2025, the asset has endured a grueling nine-month correction, shedding significant value as market liquidity tightened and macroeconomic headwinds battered the broader crypto market.
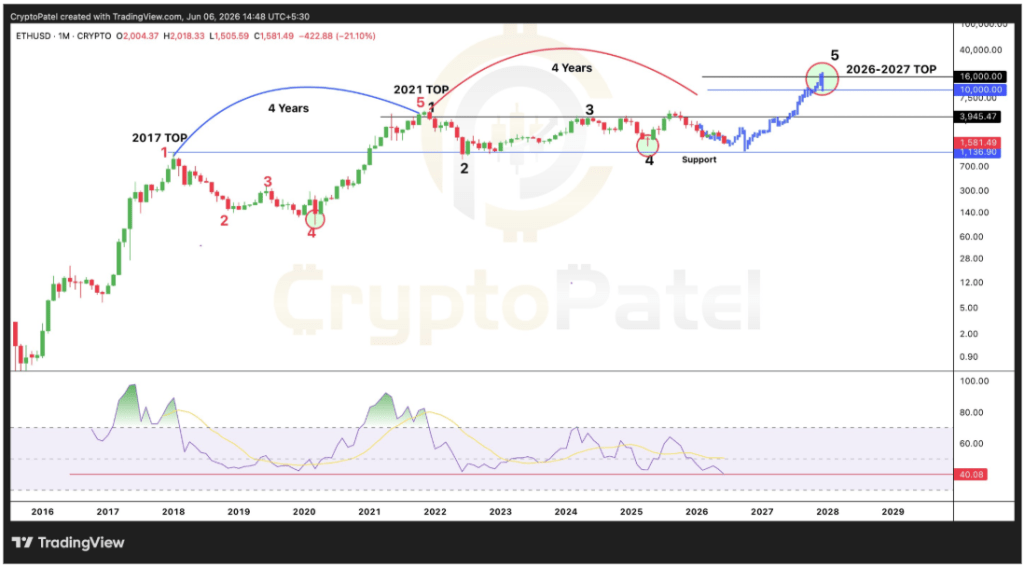
By June 2026, the downward pressure culminated in a decisive break below $1,800. Within the last 24 hours, the asset touched a low of $1,536—a price point not seen since the early stages of the current cycle. This decline has not been merely a result of market volatility; it reflects a broader shift in investor confidence. The primary catalyst for the current scrutiny is the monthly RSI, which has dropped to the 40 level. For a long-term momentum indicator, this level is deeply significant. It suggests that Ethereum is currently experiencing a level of oversold intensity that has effectively erased nearly a decade of relative strength momentum, creating a setup that both frightens and excites technical analysts.
Chronology: A Nine-Month Descent
To understand the gravity of the current situation, one must look at the timeline of Ethereum’s decline from its 2025 highs.
- August 2025: Ethereum hits a market cycle peak of $4,946. At this juncture, sentiment was overwhelmingly bullish, fueled by institutional adoption and expectations of sustained network growth.
- Q4 2025 – Q1 2026: A steady, grinding downtrend takes hold. Unlike the flash crashes of previous years, this decline has been characterized by consistent selling pressure and a lack of sustained buy-side volume to defend support levels.
- May 2026: Ethereum’s price enters a critical support zone between $1,800 and $2,000. Institutional interest, as tracked by Spot Ethereum ETF inflows, begins to fluctuate, signaling indecision among traditional financial participants.
- June 2026: The floor falls out. Ethereum breaks the $1,800 barrier. By early June, the price dips to $1,536, and the monthly RSI signals an extreme exhaustion phase, triggering a re-evaluation of long-term price targets.
Supporting Data: The RSI Anomaly
The Relative Strength Index (RSI) is a momentum oscillator that measures the speed and change of price movements. Typically, an RSI below 30 is considered "oversold," suggesting a potential price correction to the upside. However, on the monthly timeframe, the RSI is a much heavier, more significant tool.

The current reading of 40 is unprecedented. Never since the genesis of Ethereum in 2015 has the asset spent this much time in a state of sustained, monthly momentum decay. Yet, historical context provides a glimmer of hope.
- The 2020 Precedent: In 2020, following a deep RSI reset, Ethereum launched from a base of approximately $88 to reach a 2021 peak of over $4,800.
- The 2022 Precedent: Another deep reset in 2022 preceded a recovery from $880 to the 2025 all-time high.
While past performance is never a guarantee of future results, the consistency of these patterns suggests that Ethereum’s current "momentum floor" may be a prerequisite for a new, larger cycle. The fact that the 2026 RSI is the lowest in history could imply that the coming move, should it materialize, may be significantly more volatile—and potentially more rewarding—than previous iterations.
Institutional Pulse: The ETF Conundrum
The role of Spot Ethereum ETFs has added a layer of complexity to the price action. These products were intended to provide a bedrock of institutional demand, but recent data shows a precarious trend.
On June 4, 2026, the market saw a brief moment of relief when ETFs recorded $19 million in net inflows, breaking a 17-day streak of outflows. However, this optimism was fleeting. By the close of the week, the session returned to negative territory with $5.97 million in net outflows. This "tug-of-war" between retail fear and institutional accumulation is precisely why the $1,600 region is currently being watched so closely. If institutional buyers do not step in to solidify this floor, the lack of depth in the order books could lead to further, albeit temporary, downside volatility.
Implications: A $10,000 Horizon?
Despite the gloom, long-term technical projections remain remarkably ambitious. Many analysts are looking at the four-year cycle theory, which maps the movement from the 2017 top to the 2021 peak, and now extends into 2026-2027.
H3: The Cycle Projection
If the four-year cycle holds true, we are currently in the "accumulation phase" that historically precedes the final vertical leg of a bull market. Some analysts project that the next major cycle peak could reach as high as $10,000. This theory relies on the premise that the "Golden Triangle" of Ethereum’s network utility—Layer 2 scaling, staking yields, and institutional adoption—will eventually overcome current macroeconomic liquidity constraints.
H3: The Risks of the Bearish Sentiment
Conversely, the bearish case is equally compelling. The current market is heavily influenced by high interest rates and a general risk-off environment for speculative assets. If the RSI reset does not lead to an immediate bounce, and if the $1,600 support fails to hold, the market may enter a "capitulation phase" where further selling could drag the price into the $1,200–$1,300 range. This would test the resolve of even the most dedicated "HODLers."
Conclusion: The Path Forward
Ethereum stands at a pivotal juncture. The technical data—specifically the historic RSI reset—suggests we are at a point of extreme exhaustion. While the immediate price action below $1,800 is undoubtedly bearish, the historical precedent of such deep resets cannot be ignored.
Investors are left with two primary scenarios:
- The Recovery Scenario: The market has hit a fundamental bottom. The RSI reset is clearing the "dead weight" of leveraged positions, setting the stage for a new bull market toward the $10,000 target by 2027.
- The Structural Breakdown: The current cycle is fundamentally different from those of 2020 and 2022, and the RSI exhaustion is not a reversal signal but a symptom of long-term structural decline.
As of now, the burden of proof lies with the bulls. They must demonstrate that the $1,600 support level can hold against the current wave of negative sentiment. For Ethereum, the coming weeks will likely determine whether this is the start of a historic recovery or a deeper slide into a prolonged bear market. For now, the crypto community watches the charts with bated breath, knowing that in the world of decentralized finance, the most extreme indicators often precede the most significant shifts in market direction.