XRP Hits Historic RSI Lows: A Watershed Moment or Technical Anomaly?
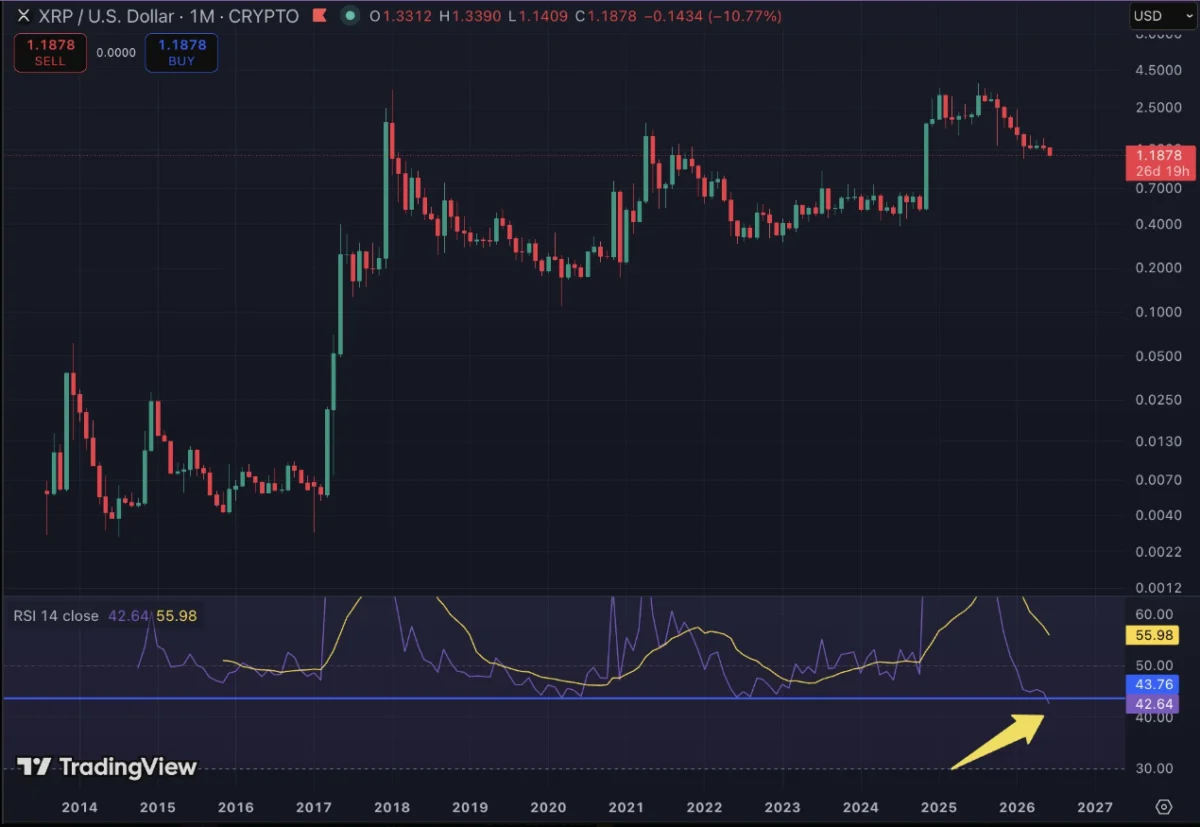
The cryptocurrency market is currently navigating a period of profound volatility, with XRP finding itself at the epicenter of a technical debate that has captured the attention of analysts and institutional observers alike. As of mid-June 2026, the XRP monthly Relative Strength Index (RSI) has plummeted to 41.64—a figure that marks the lowest reading ever recorded for the digital asset. This technical milestone surpasses the previous historic low of 43.75, set during the dark days of March 2020, when the token bottomed out at $0.11 amid a global liquidity crisis.
While the technical data suggests an unprecedented level of "oversold" sentiment on a long-term timeframe, market participants are divided on whether this signals a generational buying opportunity or a warning of further structural decay.
The Anatomy of a Technical Milestone
The Relative Strength Index (RSI) is a momentum oscillator used by traders to measure the speed and change of price movements. Traditionally, an RSI reading below 30 is classified as "oversold," suggesting that an asset may be undervalued and due for a trend reversal. Conversely, readings above 70 are typically considered "overbought."
XRP’s current monthly RSI of 41.64 is unique. It sits well above the traditional "oversold" threshold of 30, yet within the context of XRP’s historical price action, it is undeniably significant. This reading represents the weakest momentum the asset has exhibited since its inception.
Market commentator Austin, a prominent voice within the XRP community, was the first to draw public attention to this trend. His initial analysis highlighted a reading of 42.64 when the price touched $1.18. As the selling pressure continued to mount, dragging the token down to its current trading range of approximately $1.10–$1.11, the RSI subsequently drifted lower to 41.64. This decline is not merely a short-term blip; it is the culmination of a prolonged bearish trend that has seen XRP shed roughly 61% of its value since its October 2025 peak of $2.84.
A Chronology of Decline: From October Highs to June Lows
To understand the severity of the current situation, one must look at the timeline of the last nine months. Following an impressive rally in late 2025 that pushed XRP to $2.84, the asset entered a grueling period of distribution.

- October 2025: XRP reaches a local cycle high of $2.84, fueled by optimistic market sentiment and high liquidity.
- Late 2025 – Q1 2026: A sustained decline begins. Despite minor rallies, the token consistently prints lower highs, indicating a lack of conviction from buyers.
- February 2026: XRP price levels drop to the $1.10 range, a support zone that is currently being re-tested in June.
- June 2026: The RSI hits its historic low of 41.64. The market cap for the asset has shrunk from $82.5 billion at the beginning of the week to approximately $69 billion—a contraction of roughly 15% in just seven days.
This chronology paints a picture of a market that has slowly been drained of its momentum. Unlike the "flash crash" scenarios often seen in crypto, XRP’s current slide has been methodical and persistent, suggesting that the pressure is not merely a result of speculative trading but potentially a shift in long-term capital allocation.
The "Caveat" Factor: Why June Matters
Despite the alarm bells ringing across social media platforms, seasoned traders are advising caution. It is vital to note that the monthly RSI reading is not "locked in" until the final day of June.
Technical analysts point out that if XRP manages a robust recovery to above $1.30 before the month concludes, the RSI could close significantly higher than its current levels. In such a scenario, the "historic low" would be dismissed as a temporary fluctuation rather than a definitive signal of long-term exhaustion. The significance of the signal is, therefore, entirely contingent on the price action of the next few weeks. If the candle closes near its current levels, the bearish signal will be confirmed; if the price recovers, the RSI will likely reset to a more neutral zone.
Supporting Data: Broader Market Headwinds
The struggle facing XRP is not occurring in a vacuum. The broader cryptocurrency market has been under immense pressure this week, with the total market capitalization shedding approximately $330 billion.
Bitcoin, the bellwether of the asset class, saw its price dip toward $63,000 following news that Strategy—the firm associated with Michael Saylor—had offloaded 32 BTC from its massive holding. While the amount sold was negligible in the context of the firm’s total reserves of over 800,000 BTC, the market reacted with characteristic sensitivity, triggering a wave of liquidations across altcoins.
This macro environment complicates the outlook for XRP. When Bitcoin faces a correction, altcoins historically suffer a leveraged downside, often falling two to three times as hard as the flagship asset. With XRP already struggling with internal momentum issues, the broader market downturn has acted as a catalyst, accelerating the drop in the RSI.
Historical Precedents: The 2020 Comparison
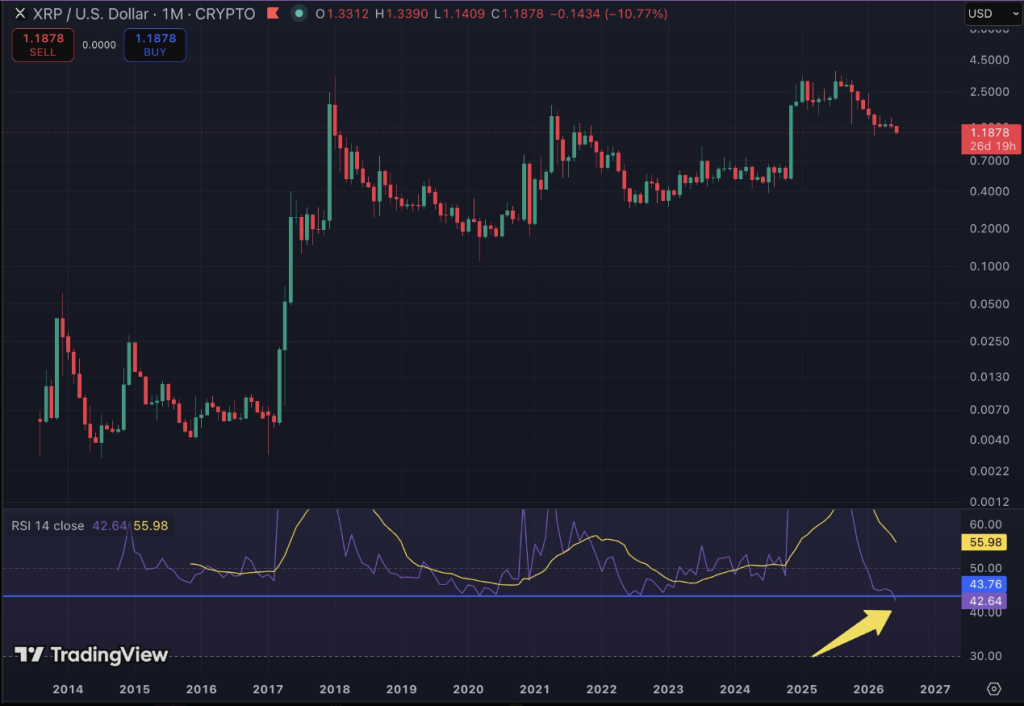
History provides a potential roadmap, though analysts warn that no two market cycles are identical. In March 2020, XRP hit an RSI of 43.75, which ultimately marked the absolute bottom of that cycle. Following that low, XRP embarked on a significant recovery, posting a series of higher lows that culminated in a price of $1.96 by April 2021.
Later, in November 2024, the asset experienced a massive surge, climbing to $3.40. This represented a 580% gain from the cycle lows of the preceding year. If the 2026 RSI low were to function similarly to the 2020 low, it would theoretically suggest that XRP is nearing a major "accumulation zone." However, the current economic landscape—marked by different interest rate environments and regulatory shifts compared to 2020—means that past performance is not a guarantee of future results.
Implications for Investors and the Ecosystem
The current state of XRP has significant implications for both retail investors and institutional stakeholders.
- For Retail Traders: The RSI, while historically low, serves as a double-edged sword. For those with a long-term horizon, the current levels may represent a "value buy." However, for those using leverage, the uncertainty regarding whether the RSI will close at these levels presents a high-risk environment.
- For Institutional Players: The decline in market cap to $69 billion suggests that large-scale institutional interest is currently sidelined. Institutional capital typically seeks stability; a breach of key technical support levels often leads these players to wait for a "re-test" of lows before committing fresh capital.
- For the Ecosystem: The lack of price momentum often impacts the development ecosystem. When the price of an asset remains suppressed for an extended period, it can lead to a decline in project activity and liquidity, creating a self-reinforcing loop of stagnation.
Conclusion: The Waiting Game
As the market waits for the close of the June monthly candle, the mood remains tense. The XRP community is looking to the $1.30 level as the critical line in the sand. If the token can reclaim this price point, the "historic RSI low" will likely fade into obscurity as just another data point in a volatile year. If it cannot, the token may face an extended period of consolidation or further downside, testing the resolve of holders who have weathered the volatility since 2025.
For now, the chart remains the primary storyteller. With XRP trading at $1.10 and the monthly RSI hovering at 41.64, the asset stands at a crossroads. Whether this moment represents the floor of a new era of growth or the beginning of a prolonged winter remains to be seen. As always in the crypto markets, the only certainty is that the next few weeks will provide the clarity that the current data points can only hint at.
Disclaimer: This article is for informational purposes only and does not constitute financial advice. Cryptocurrency investments are subject to high market risk. Always perform your own research before making investment decisions.