XRP Plunges to Historic Lows: Monthly RSI Hits Unprecedented Levels Amid Broader Crypto Market Liquidation
The digital asset’s monthly Relative Strength Index has cratered to a record 41.64, breaching historical floors last seen during the March 2020 pandemic crash. However, analysts warn that the signal remains provisional as the trading month unfolds against a backdrop of macro crypto liquidations.
Main Facts
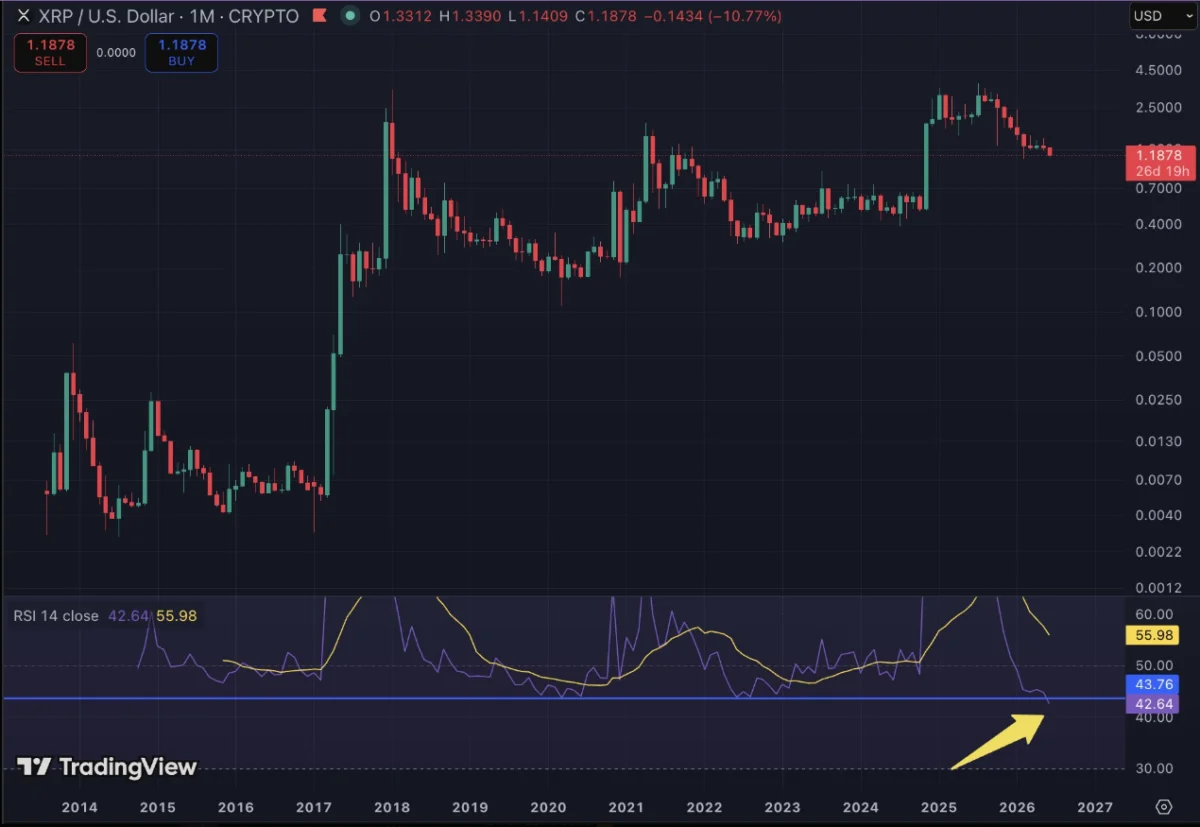
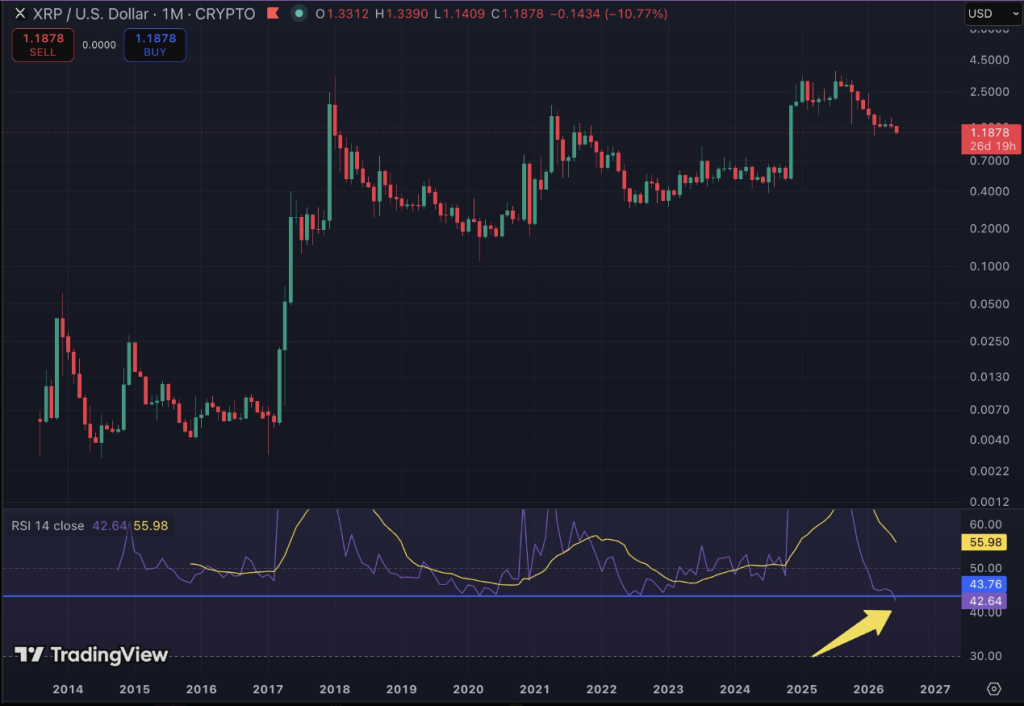
XRP, one of the digital asset industry’s legacy altcoins, has entered uncharted technical territory. As of press time, the token’s monthly Relative Strength Index (RSI)—a momentum oscillator that measures the speed and magnitude of recent price changes to evaluate overvalued or undervalued conditions—has sunk to 41.64.
This reading marks the lowest monthly RSI print in XRP’s history, eclipsing the previous all-time low of 43.75 recorded in March 2020. During that epoch, the broader financial markets were gripped by pandemic panic, and XRP bottomed out at a meager $0.11 during one of the most severe bear markets in crypto history.
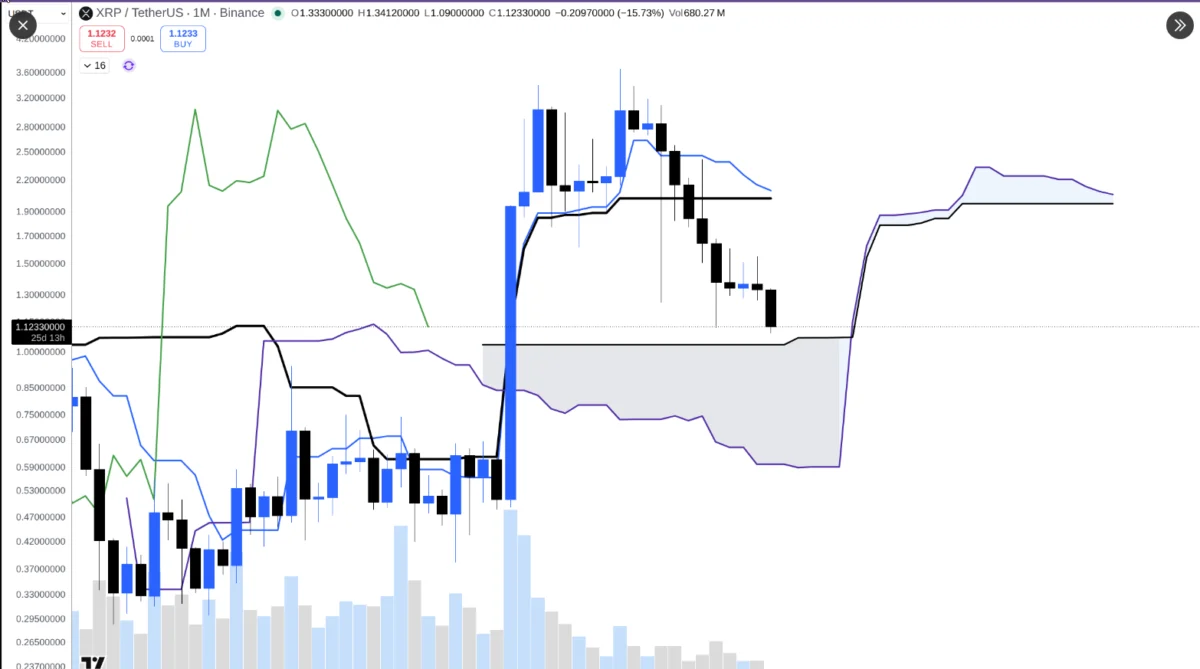
At present, XRP is changing hands at approximately $1.11. This valuation places the token roughly 61% below its multi-month high of $2.84, which was achieved in October 2025. The downward trajectory has been characterized by a persistent, grinding decline over several months, devoid of any significant relief rallies or structural trend reversals. Consequently, the token’s market capitalization has experienced severe compression, sliding from $82.5 billion at the start of the week down to approximately $69 billion—a staggering 15% wipeout in a matter of days. This contraction has dragged XRP’s price down to levels not witnessed since early February.
Despite the gloomy technical metrics, market analysts emphasize a critical caveat regarding the RSI reading. Because the monthly candle for June is still open and actively trading, the 41.64 figure is not yet finalized. Technical analysts note that if XRP manages a meaningful recovery above the $1.30 threshold before the month concludes, the monthly RSI could climb significantly, effectively nullifying the severity of the current reading.
Chronology
The unfolding technical breakdown of XRP did not happen in a vacuum; it is the culmination of a multi-month downtrend accelerated by a brutal week for the entire cryptocurrency ecosystem.
- October 2025: XRP reaches a local cycle peak of $2.84, riding a wave of positive sentiment that had previously driven prices as high as $3.40 in late 2024 (a massive 580% surge from the October 2024 lows).
- Late 2025 – Early 2026: Following its autumn peak, XRP enters a prolonged corrective phase. Prices steadily erode, breaking through multiple psychological and technical support levels over several months without establishing a firm bottom.
- February 2026: XRP slides into a price range around $1.10—a valuation it would not revisit until a sudden market-wide flush months later.
- Early June 2026: The broader crypto market experiences an aggressive liquidity drain. Bitcoin tethers downward toward the $63,000 threshold following confirmation that Strategy (formerly MicroStrategy, the firm synonymous with Michael Saylor) sold 32 BTC from its massive treasury holdings exceeding 800,000 BTC. In just seven days, the total cryptocurrency market capitalization sheds an estimated $330 billion.
- June 4, 2026: Prominent XRP community market commentator Austin (@Austin_XRPL) breaks the news to the public. Publishing a stark technical chart, Austin notes that XRP’s monthly RSI has dropped to 42.64 while the token trades at $1.18.
- Mid-June 2026: As selling pressure persists and XRP slips further to $1.11, the monthly RSI indicator ticks down even further, settling at the historic low of 41.64.
Supporting Data
To contextualize the current predicament facing XRP, market participants are turning to historical technical analysis, blockchain metrics, and macro indicators.

While a traditional RSI reading below 30 is universally classified as "oversold territory," higher-timeframe oscillators—such as the monthly RSI on legacy assets like XRP—often behave differently. A monthly RSI of 41.64 does not cross the traditional sub-30 oversold boundary, yet within the specific historical context of XRP, it represents the absolute weakest momentum configuration the asset has ever registered on a macro scale.
| Metric / Event | Historical Data (March 2020) | Current Data (June 2026) |
|---|---|---|
| Monthly RSI Low | 43.75 | 41.64 (Ongoing) |
| Token Price Floor | $0.11 | $1.10 – $1.11 |
| Recent Peak Valuation | N/A | $2.84 (October 2025) |
| Peak-to-Trough Decline | Extreme Bear Market | ~61% Correction |
| Weekly Market Cap Loss | N/A | ~$13.5 Billion (XRP alone) / $330B (Market-wide) |
Historical precedent provides both a glimmer of hope and a cautionary tale. In March 2020, the RSI low of 43.75 accurately marked the absolute cycle bottom for XRP. Following that flush, the token formed a series of higher lows, eventually clawing its way up to $1.96 in April 2021 before the broader bull market climaxed. However, market analysts caution that historical patterns are not guarantees of future performance, especially given the distinct macroeconomic headwinds facing risk-on assets in mid-2026.
Official Responses and Analyst Commentary
The unprecedented RSI print has ignited intense debate across crypto Twitter (X) and institutional trading circles. Analysts are divided on whether this metric signals a generational "buy the dip" opportunity or a warning sign of structural exhaustion.
Austin, the community commentator who first brought the metric to light, summarized the prevailing sentiment among retail holders with a succinct declaration on social media: "XRP is the most oversold on the monthly time frame that it has EVER been." His charts quickly circulated among traders looking for signs of a macro reversal.
Meanwhile, institutional desks are viewing the data through a more pragmatic, risk-managed lens. Speaking anonymously, a crypto derivatives trader noted that while momentum indicators are heavily compressed, falling knives in macro-downtrends can remain oversold far longer than leveraged traders can remain solvent.
"An RSI reading below any historical threshold sounds explosive, but until macro liquidity returns to the broader altcoin market, technical indicators are merely describing the pain, not curing it," the trader stated. "A monthly close is what matters. If June closes below $1.30, the multi-month structure remains bearish."
Corporate movements have also drawn heavy scrutiny. The confirmation that Strategy executed a minor sale of 32 BTC from its legendary treasury—while operationally negligible given its holdings of over 800,000 Bitcoin—sent a psychological shockwave through retail sentiment, triggering cascading liquidations that disproportionately punished higher-beta altcoins like XRP.
Implications
The cascading drop in XRP’s price and its unprecedented monthly RSI reading carry profound implications for short-term traders, long-term investors, and the broader altcoin ecosystem.
1. Technical Implications for XRP
If the monthly candle closes near its current levels, XRP will validate a bearish macro momentum structure that could deter institutional capital inflow. Conversely, a sharp late-month recovery reclaiming the $1.30 mark would invalidate the record-low RSI thesis, potentially sparking a sharp short-squeeze as trapped bears rush to cover leveraged short positions.
2. Retail Sentiment and HODLer Behavior
Prolonged stagnation following a 61% drawdown from October 2025 highs tests the psychological resilience of long-term XRP holders. Prolonged underperformance relative to Bitcoin or emerging narrative-driven tokens can lead to capital flight, as retail investors rotate out of legacy altcoins in search of higher-beta opportunities elsewhere.
3. Broader Market Correlations
XRP’s struggles mirror a wider malaise affecting the altcoin market. With Bitcoin facing localized selling pressure and macroeconomic uncertainty dampening institutional risk appetite, altcoins remain exceptionally vulnerable to liquidity shocks. The loss of $330 billion from the total crypto market capitalization in just one week underscores the fragility of current market structures.
As the month of June marches toward its final weeks, all eyes remain fixed on the charts. Whether XRP’s historic RSI print serves as the dark precursor to a major macro bottom—similar to the spring of 2020—or simply another waypoint in a prolonged structural decline depends entirely on whether buyers can muster the volume required to reclaim critical technical levels before the monthly candle closes.