XRP Hits Uncharted Technical Territory: Monthly RSI Plummets to Record Lows Amid Broader Crypto Market Liquidation
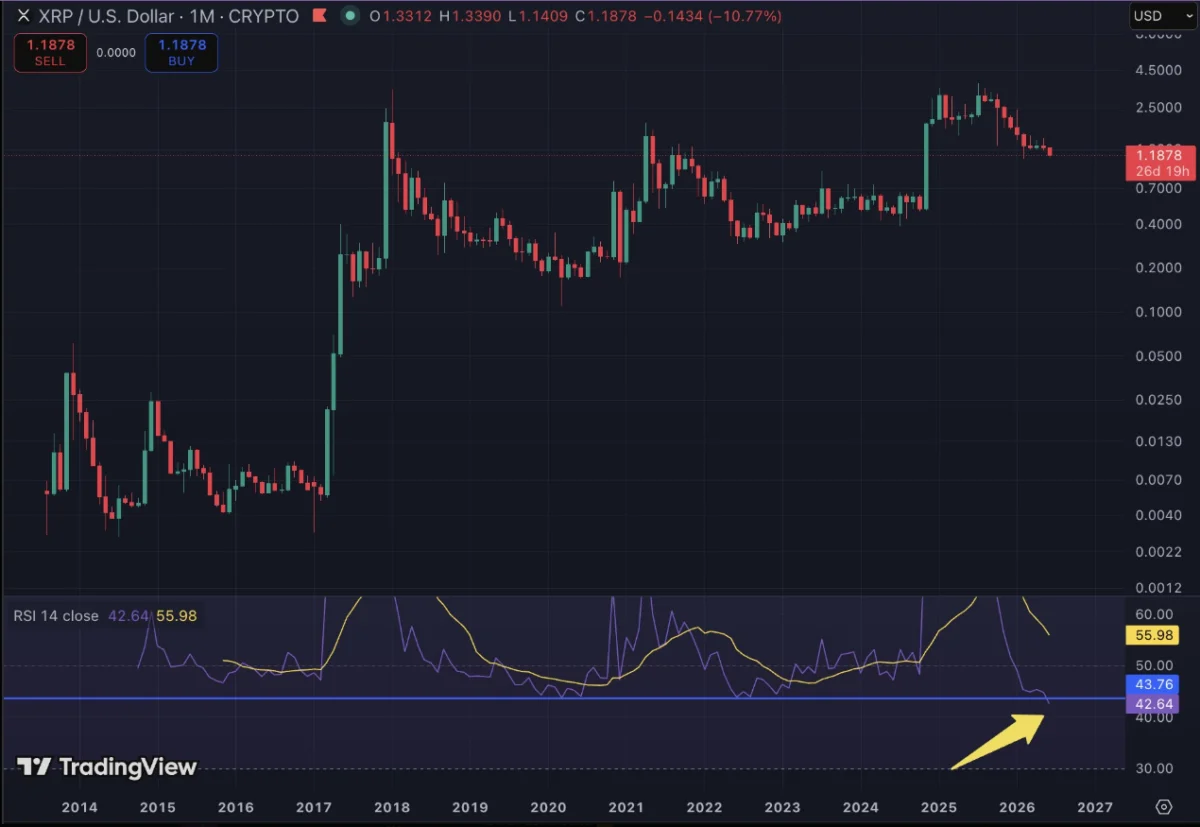
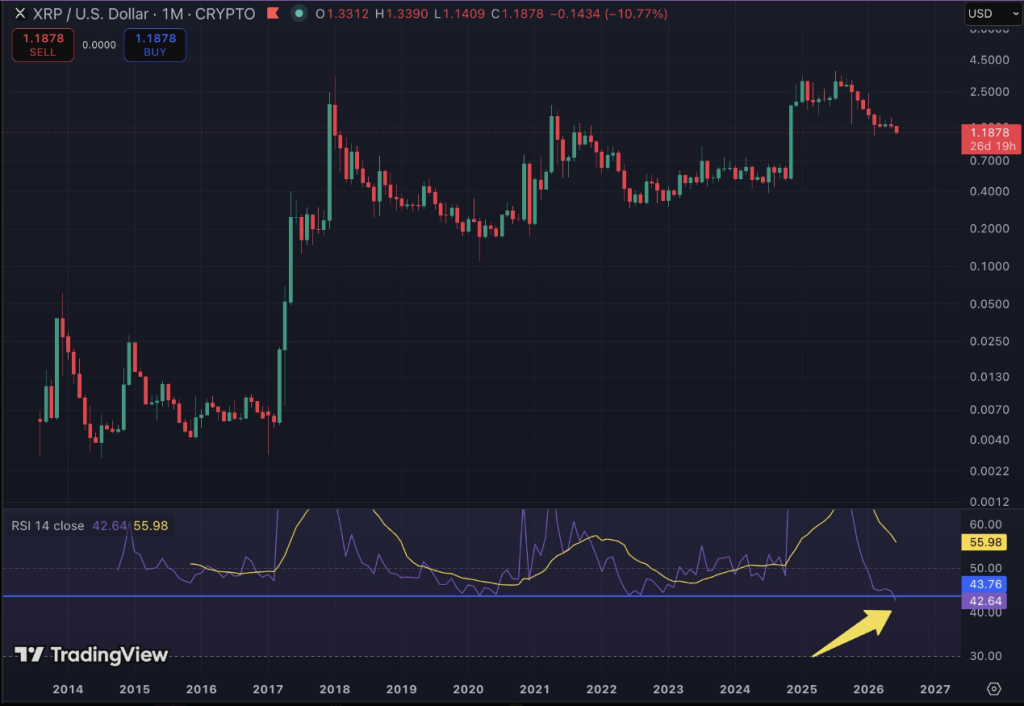
The digital asset’s monthly Relative Strength Index has slipped to an all-time low of 41.64, surpassing the previous trough seen during the March 2020 market capitulation. However, market analysts emphasize that with weeks remaining in the monthly candle, the signal carries a vital caveat.
Main Facts
XRP has plunged into unprecedented technical depths, registering the lowest monthly Relative Strength Index (RSI) in its trading history. According to market data, the token’s monthly RSI dropped to 41.64, breaching the previous historical low of 43.75 recorded in March 2020. During that infamous pandemic-era crash, XRP bottomed out at a meager $0.11 amidst one of the most severe bear markets in cryptocurrency history.
At the time of writing, XRP changes hands at approximately $1.10, down roughly 61% from its October 2025 peak of $2.84. This persistent, multi-month correction has severely compressed the asset’s valuation, wiping billions from its network capitalization. The token’s market cap experienced a steep contraction over a single week, sliding from $82.5 billion down to roughly $69 billion—a staggering 15% loss in days that dragged prices back to levels last witnessed in early February.
Despite the gloomy technical reading, market participants have pointed out a crucial caveat: the current monthly candle for June remains open. Technical analysts note that if XRP manages a recovery rally above $1.30 prior to the month’s close, the RSI will adjust significantly upward, rendering the current historic reading largely a temporary artifact of intra-month volatility rather than a finalized structural indicator.
Chronology
The timeline of XRP’s descent highlights a protracted period of distribution and downward momentum stretching deep into mid-2026:
- October 2025: XRP reaches a local high of $2.84, culminating a robust bullish phase that had previously seen prices test heights near $3.40 in late 2024.
- Late 2025 – Early 2026: The token enters a prolonged corrective channel, suffering months of downward pressure without a meaningful macro-level recovery.
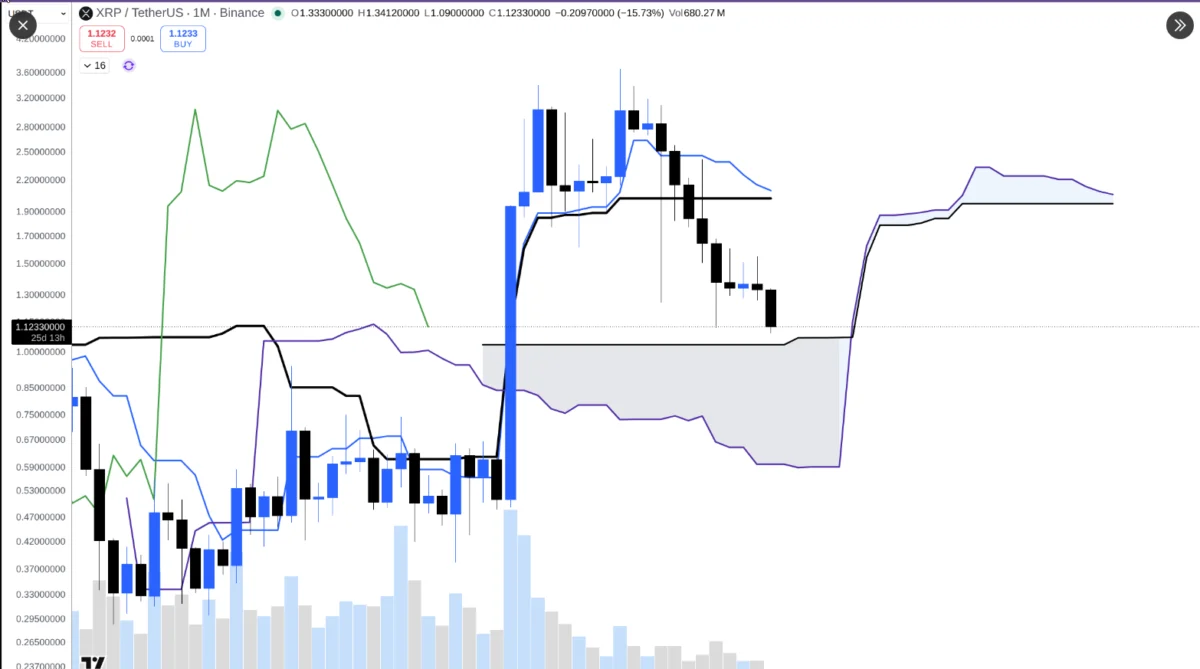
- Early February 2026: XRP touches price levels around $1.10, a threshold that would later re-emerge as a crucial support zone during mid-year liquidations.
- Early June 2026: Broader macroeconomic and crypto-specific headwinds trigger a violent market-wide correction. Bitcoin retreats toward the $63,000 threshold, and the aggregate crypto market capitalization sheds an astonishing $330 billion in the span of just seven days.
- June 4, 2026: Prominent XRP community commentator "Austin" takes to social media platform X to publicly flag an unprecedented technical event. His initial charts reveal that the monthly RSI has dipped to 42.64 as XRP prices slide to $1.18.
- Mid-June 2026: Continued selling pressure pulls the price down further to $1.11, subsequently dragging the monthly RSI down to its current record-breaking level of 41.64.
Supporting Data
To contextualize the current state of XRP’s market structure, examining the underlying metrics, comparative historical data, and macroeconomic triggers is essential.
RSI Mechanics and Historical Context
The Relative Strength Index is a momentum oscillator that measures the speed and magnitude of recent price changes to evaluate overvalued or undervalued conditions. Traditionally, an RSI reading below 30 is categorized as "oversold," while readings above 70 indicate "overbought" territory.

While XRP’s absolute monthly RSI figure of 41.64 sits numerically above the traditional 30 threshold, it represents the lowest momentum reading ever logged on a macro timeframe for this specific asset. To put this in perspective:
- March 2020 Low: RSI hit 43.75, coinciding with a price floor of $0.11.
- June 2026 Reading: RSI sits at 41.64 (subject to monthly close adjustments), with a current spot price hovering near $1.10 to $1.11.
Broader Market Contagion
XRP’s struggles do not exist in a vacuum. The wider digital asset ecosystem experienced severe contractions during this reporting period. A notable catalyst arrived when Strategy (the enterprise intelligence firm historically recognized for massive Bitcoin accumulations under Michael Saylor) confirmed the sale of 32 BTC from its massive treasury holding of over 800,000 bitcoins.
This unexpected transaction catalyzed a wave of risk-off sentiment across derivatives and spot markets. Consequently, the global crypto market cap evaporated by $330 billion in a single week. Bitcoin itself stumbled toward $63,000, dragging down major altcoins, including XRP, which saw its market capitalization shrink from $82.5 billion down to $69 billion in a matter of days.
Official Responses and Community Reactions
The crypto community and prominent analysts have reacted with a mixture of apprehension and opportunistic optimism to the historic technical readings.
Austin, a well-known market commentator within the XRP ecosystem, was the first to sound the alarm regarding the deteriorating momentum indicators. Sharing his analysis on X, Austin emphasized the gravity of the shift, noting:
"XRP is the most oversold on the monthly time frame that it has EVER been."
While bearish market participants view the sustained bleed from the $2.84 October high as a sign of structural weakness and fading institutional interest, long-term proponents are drawing parallels to past cycles. Analysts monitoring the historical price action note that historical bottoms often arrive alongside extreme technical exhaustion.
Official corporate statements regarding the flash crash have primarily focused on macro liquidity conditions. Major trading desks attribute the recent bleed to broader liquidations across leveraged long positions rather than fundamental network utility failures for XRP or the XRPL ecosystem.
Implications
What does a record-low monthly RSI mean for the future trajectory of XRP? Financial markets operate on cycles, and extreme readings on higher timeframes (such as monthly charts) typically carry heavy implications for medium-to-long-term forecasts.
1. Historical Precedent as a Blueprint
Looking back at the March 2020 crash provides a fascinating historical blueprint, though market veterans caution that past performance never guarantees future results. Following its RSI bottom and price floor of $0.11 in early 2020, XRP did not immediately skyrocket; instead, it formed a series of higher macro lows before exploding upward to $1.96 by April 2021. A subsequent bullish cycle in late 2024 drove the asset as high as $3.40, marking an approximate 580% surge from its cyclical lows.
If history rhymes, the current compression phase—painful as it is for holders enduring a 61% drawdown from October 2025—could be laying the groundwork for a generational accumulation zone.
2. The Danger of Fake-Outs and Closing Candles
Traders must exercise extreme caution until the monthly candle officially closes. Because the month of June is still active, any aggressive market-wide relief rally that pushes XRP back above the $1.30 threshold will invalidate the record-low RSI signal. Technical indicators calculated on open timeframes are notoriously susceptible to end-of-month price whipsaws.
3. Macroeconomic and Regulatory Pressures
Ultimately, XRP’s path forward depends heavily on macro liquidity injections, the health of Bitcoin’s price action, and regulatory clarity. Should the broader crypto market stabilize and reclaim lost territory above key psychological supports, oversold altcoins like XRP historically experience sharp, aggressive mean-reversion rallies. Conversely, if macro conditions deteriorate further and Bitcoin breaks down past $63,000, historic technical supports could be tested in ways that force a complete reassessment of the token’s cyclical floor.