The Ethereum Paradox: Record-Breaking Network Utility Amidst Price Volatility
In the volatile landscape of the digital asset market, a compelling dichotomy has emerged surrounding Ethereum (ETH). While the asset’s price action remains mired in bearish sentiment, threatening to test key psychological support levels near the $1,500 threshold, the underlying blockchain infrastructure is experiencing its most prolific period of activity in history. This divergence between price and utility has sparked intense debate among analysts, as Ethereum continues to solidify its role as the backbone of decentralized finance (DeFi), institutional tokenization, and global blockchain applications.
Main Facts: The Great Decoupling
The current market cycle has presented a fascinating case study in blockchain fundamentals. Typically, price and network activity exhibit a strong positive correlation; however, the 2025–2026 cycle has witnessed a dramatic departure from this trend.
As ETH struggles to maintain its footing above the $1,600 support level, the network’s internal metrics—such as daily active addresses and total transaction throughput—are hitting all-time highs. This suggests that the current bearish price action is not a reflection of a dying ecosystem, but rather a decoupling caused by external macroeconomic pressures, shifts in liquidity, and a transition in the investor base from short-term speculators to long-term "HODLers."
Chronology of Network Growth
To understand the significance of the current activity, one must look at the historical trajectory of the Ethereum network.
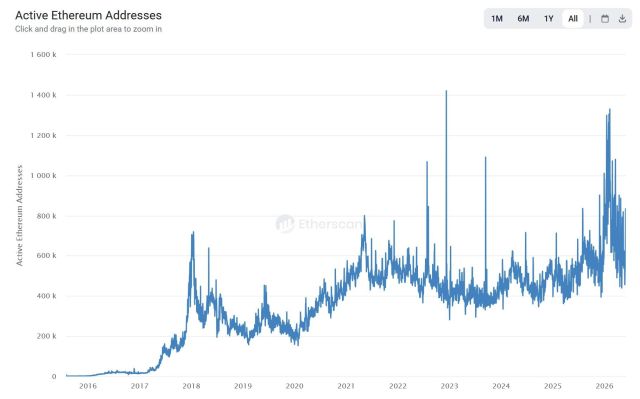
- 2018 (The Growth Phase): During the post-ICO boom, the network saw daily active addresses peak at approximately 720,000. At the time, this was considered a massive achievement for a fledgling smart contract platform.
- 2021 (The Bull Market Peak): As DeFi Summer and the NFT craze took hold, daily active addresses surged to 800,000, setting a new benchmark for blockchain adoption.
- 2025–2026 (The Current Cycle): The most recent data reveals a seismic shift. Daily active addresses have consistently pushed past the 1 million mark, with periodic peaks exceeding 1.3 million.
This data, highlighted by research from Lisk’s Head of Research, Leon Waidmann, confirms that the Ethereum network is currently processing significantly more real-world activity than it was during the height of the 2021 bull market. This growth is not driven by speculative mania but by the maturation of the network as a foundational layer for institutional-grade financial applications.

Supporting Data: The Exodus from Exchanges
One of the most telling indicators of investor sentiment is the movement of ETH off centralized exchanges. In traditional market theory, high liquidity on exchanges often precedes selling pressure. Conversely, the mass withdrawal of assets into cold storage is a bullish indicator, signaling long-term conviction.
As of recent reporting, the balance of ETH held on cryptocurrency exchanges has plummeted to approximately 14.5 million—the lowest level in history. This represents a staggering reduction, with over 6 million ETH pulled off exchanges in the last 30 months alone.
Waidmann’s commentary on this trend is succinct and telling: "Whoever is buying here isn’t selling back." The lack of exchange inflows during periods of intense market volatility—a time when investors typically panic-sell—suggests that the current "Ethereum holders" are largely immune to short-term price fluctuations and are focused on the long-term utility of the Ethereum ecosystem.
The Delta Price and the Search for a Bottom
While network metrics are flashing green, technical analysts are laser-focused on identifying a floor for the price. Ali Charts, a prominent analyst in the crypto space, has utilized the "Delta Price" metric to gauge where the bottom might lie.
The Delta Price is a unique indicator that maps the relationship between the cost basis of long-term investors and the average production cost of miners. Historically, this metric has been highly accurate in identifying deep accumulation zones. By analyzing the current trajectory of the Delta Price, Ali Charts suggests that the absolute price floor for Ethereum could hover around $700.

While the prospect of a drop to $700 is daunting for retail investors, the analysis frames this as a "final retest" required to flush out the remaining leveraged positions before a sustained, healthy upward trend can commence.
Official Perspectives and Institutional Implications
The implications of this data are profound. Ethereum is no longer just a "crypto asset"; it is increasingly functioning as a global settlement layer. The rise in daily active addresses, despite a lackluster price performance, suggests that institutional developers and enterprises are not waiting for a bull market to build on the chain.
Decentralized Banking and Tokenization
The surge in activity is heavily linked to the expansion of Real-World Asset (RWA) tokenization. Major financial institutions are increasingly leveraging the Ethereum mainnet and its Layer-2 scaling solutions to tokenize treasury bills, real estate, and carbon credits. This shift is turning Ethereum into a "yield-bearing" backbone for the next generation of global finance.
Developer Engagement
Despite the "bearish price" narrative, developer activity—often measured by repository commits and smart contract deployments—remains near record highs. This indicates that the talent pool remains committed to the ecosystem, which is the ultimate leading indicator for future network value.
Risks and Market Sentiment
Despite the bullish fundamental data, investors must remain cognizant of the risks. The threat of regulatory scrutiny in various jurisdictions, the competition from high-throughput "Ethereum killer" blockchains, and the potential for a broader macroeconomic recession continue to weigh on the asset.
Furthermore, the "price vs. utility" gap cannot stay wide forever. In the short term, the market often ignores fundamentals in favor of liquidity-driven price action. If the broader equity markets continue to struggle, Ethereum may be dragged down to the levels projected by the Delta Price metric, regardless of how many users are active on the chain.
Conclusion: The Quiet Accumulation
The current state of Ethereum is one of the most intriguing in its history. On the surface, the price charts show a struggle for stability. Under the surface, the data reveals a network that has never been more vital, more used, or more "locked away" in private wallets.
The divergence between the price of ETH and the utility of the Ethereum network is a classic setup for a significant market pivot. History suggests that when the underlying fundamentals of a network diverge this sharply from its market value, the eventual resolution is a violent correction to the upside. For the long-term investor, the record-breaking network activity and the massive withdrawal of supply from exchanges offer a compelling argument that the current "bearish" phase may be the most significant accumulation opportunity in the history of the asset.
As the industry moves toward 2026, the question is not whether Ethereum will survive, but how the price will eventually reflect the reality of its unprecedented adoption. The data, provided by industry experts and reinforced by blockchain analytics, points to a network that is ready for the next phase of growth—provided that the investors can weather the volatility of the road ahead.