

Ethereum Plunges Below $1,800 as Monthly RSI Hits Historic Lows: Are We Nearing a Cycle Bottom?
By Financial Markets Desk
Published: June 2026
1. Main Facts: The Anatomy of Ethereum’s Historic Sell-Off
The broader cryptocurrency market has plunged into a severe, pervasive bearish sentiment, dragging Ethereum (ETH), the world’s leading altcoin, down with it. In a brutal wave of liquidations and sell-offs, Ethereum’s price has crashed beneath the critical psychological and technical support level of $1,800.
This dramatic downward spiral has placed immense pressure on the asset’s monthly charts. More alarmingly for long-term investors and technical analysts, Ethereum’s monthly Relative Strength Index (RSI) has plummeted to its lowest level in the digital asset’s history—a reading not seen since the network’s inception in 2015.
While the falling price action has triggered widespread panic across retail markets, institutional and structural metrics reveal a far more nuanced narrative. Historically, these extreme monthly RSI resets have not signaled the death of the asset, but rather have coincided with major macroeconomic and cycle bottoms. As ETH trades near multi-year lows, market participants are left asking a defining question: Is this historic indicator reading a harbinger of a prolonged crypto winter, or is it the ultimate capitulation phase preceding a monumental multi-year expansion?
2. Chronology: A Brutal Nine-Month Descent
To understand the gravity of Ethereum’s current standing, one must examine the timeline of its descent from previous market highs:
- August 2025: Ethereum reaches a cycle peak, touching an impressive all-time high of $4,946. Market optimism is riding high, fueled by robust decentralized finance (DeFi) activity and sustained institutional interest.
- Late 2025 to Early 2026: Macroeconomic headwinds, regulatory tightening, and declining liquidity across global financial markets begin to weigh heavily on risk-on assets. Ethereum enters a persistent, grinding downtrend.
- June 2026: The bearish pressure accelerates into a full-scale capitulation event. Ethereum breaks below the heavily defended $1,800 threshold.
- The Past 24 Hours: ETH plunges further, hitting an intraday low of $1,536—its weakest price performance of the entire 2026 calendar year. At the time of reporting, the asset hovers precariously around $1,612, forcing market bulls into an emergency defense of the $1,600 region.
- June 4–5, 2026: Spot Ethereum Exchange-Traded Funds (ETFs) briefly break a punishing 17-day streak of continuous outflows, recording $19 million in net inflows on Thursday, June 4. However, the relief is short-lived; Friday’s trading session immediately reverses course, logging $5.97 million in net outflows and highlighting the fragile state of institutional confidence.
3. Supporting Data: Unprecedented RSI Readings and Historical Parallels
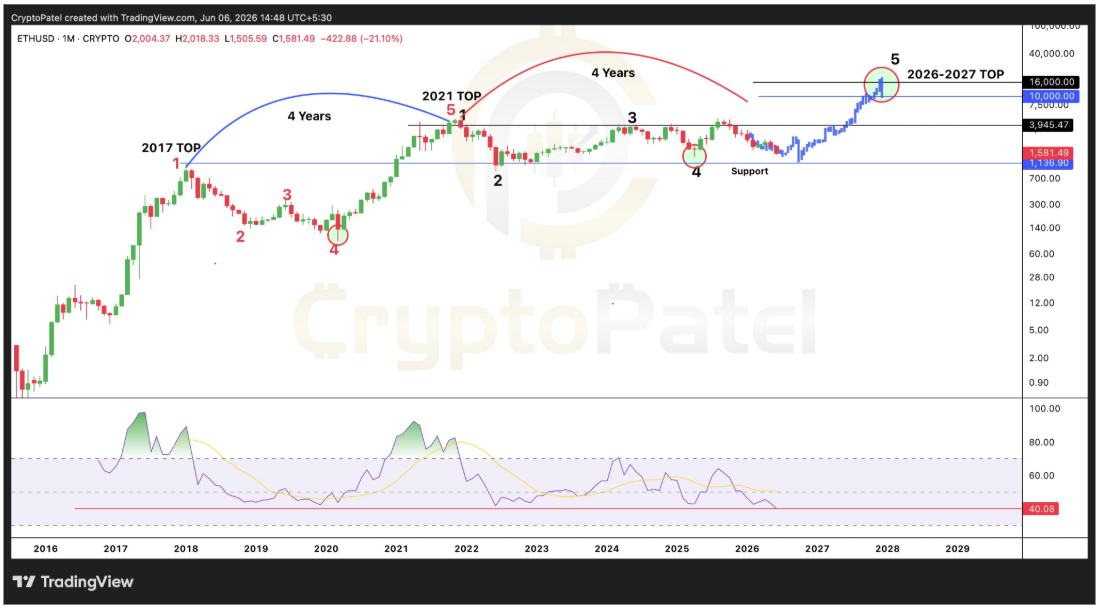
The most compelling piece of data in the current market structure is the behavior of the monthly Relative Strength Index (RSI). Following the June price crash, the monthly RSI on the ETH/USD chart has dropped to approximately 40. This marks the lowest reading on a monthly timeframe since Ethereum began public trading in 2015, superseding even the deepest readings recorded during past macro panics.

Historical Context: The 2020 and 2022 Resets
Market historians and technical analysts are drawing parallels between the current setup and two previous structural resets:
- The 2020 Cycle Low: Amid the global financial shock brought on by the COVID-19 pandemic, Ethereum’s RSI reached deeply depressed levels. What followed was one of the most explosive bull runs in crypto history, with ETH surging from roughly $88 to its 2021 peak of over $4,800.
- The 2022 Bear Market: Following the collapse of major industry entities and macroeconomic tightening, another deep RSI reset occurred. ETH eventually found a bottom near $880 before embarking on a steady upward trajectory that culminated in its 2025 all-time high of $4,946.
Comparing 2026 to Past Cycles
While technical indicators suggest that Ethereum has entered a momentum zone historically associated with major cycle bottoms rather than tops, analysts urge caution. Past performance does not guarantee future results. However, a critical distinction separates the 2026 setup from its predecessors: the monthly RSI has dropped even lower than in 2020 or 2022.
Because the current reading is the most extreme in Ethereum’s history, some technical analysts theorize that if historical cyclical patterns repeat, the magnitude of the eventual relief rally and subsequent expansion could outpace those of previous cycles.
4. Official Responses and Market Commentary
As the market digests these historic technical readings, industry analysts, ETF market makers, and prominent traders have weighed in on the trajectory of the world’s premier smart-contract platform.
Prominent crypto analyst @CryptoPatel noted on social media platform X (formerly Twitter) that the monthly chart structure is testing the absolute limits of historical momentum indicators. The accompanying chart analysis points toward a macro four-year cycle model, drawing parallels between the 2017 top, the 2021 peak, and a projected cycle target.
Meanwhile, institutional desk managers monitoring Spot Ethereum ETFs have expressed cautious restraint. While the single-day injection of $19 million on June 4 offered a fleeting glimpse of renewed buyer appetite, the immediate reversion to net outflows on June 5 underscores that institutional investors remain deeply risk-averse.
"Traditional finance capital is not going to aggressively step in while the macroeconomic landscape remains volatile and native crypto assets are breaking multi-month technical supports," noted an institutional derivatives trader who requested anonymity. "The market needs to establish a definitive base before institutional allocators feel comfortable re-engaging with high-beta tech and crypto exposures."
5. Implications: Navigating the Macro Outlook and the Road to $10,000
The convergence of plunging spot prices, capitulation-level RSI metrics, and erratic ETF flows has profound implications for the immediate and long-term future of Ethereum.
Immediate Risks and Bullish Tasks
In the short term, the immediate burden falls squarely on the shoulders of market bulls. Defending the $1,600 support zone is critical. Failure to hold this region could invite cascading liquidations, potentially driving ETH toward deeper historical support levels near the $1,200–$1,400 band. To reverse the current momentum, bulls will need to spark sustained spot inflows and definitively reclaim the lost $1,800 resistance level.
Long-Term Macro Projections: The Four-Year Cycle Theory
Despite the grim near-term outlook, long-term technical analysts are looking past the current volatility toward the broader multi-year horizon. When examining Ethereum through the lens of a macro four-year cycle framework:
- The 2017 cycle peak marked the end of Ethereum’s early adoption phase.
- The 2021 cycle high cemented its status as the dominant layer-1 smart contract ecosystem.
- Long-term structural projections on the monthly timeframe continue to model a potential "golden triangle" trajectory, with some optimistic technical models projecting a possible cycle top in the $10,000 range between 2026 and 2027.
Whether this ambitious target remains viable depends entirely on whether current price action represents the "final flush" of a brutal bear market phase or the beginning of a deeper systemic contraction. For now, Ethereum stands at a historic crossroads, testing the psychological resolve of its investor base and the reliability of its multi-year technical indicators.