

XRP Primed for Historic Parabolic Surge? Analysts Spot Repeating Patterns and Multi-Dollar Targets Amid Imminent Volatility
Cryptocurrency markets are once again training their sights on XRP as prominent chart analysts uncover technical formations mirroring the historic rallies of previous cycles. Despite a prevailing short-term downtrend that has tested investor resolve, seasoned market experts suggest that a major structural setup is quietly taking shape beneath the surface—one that could reverse current losses and propel the digital asset into unprecedented price territory.
According to recent insights shared by crypto analyst Blacksea and fellow market strategist Celal Kucuker, XRP is tracing classic bullish reversal patterns. While the immediate outlook warns of potential shakeouts and localized price corrections, the macro configuration points toward triple-digit—and potentially staggering quadruple-digit—percentage gains if historical precedents repeat themselves.
Main Facts: The Bullish Setup and Key Levels
The core narrative revolves around two major technical formations currently developing on the XRP charts: a recurring falling wedge pattern and a macro Cup & Handle structure.
- The Falling Wedge Analog: Analyst Blacksea has highlighted that XRP has printed a technical falling wedge pattern nearly identical to the setup observed in 2024. During that prior cycle, XRP consolidated tightly around the $0.50 region before a classic false breakdown triggered an aggressive trend reversal, culminating in a 600% surge past $1.50.
- Current Market Standing: Trading at approximately $1.07, XRP is experiencing downward pressure and price compression within its current wedge boundaries. Analysts suggest a final fakeout or shakeout could occur before momentum shifts definitively to the upside.
- Ambitious Long-Term Targets: Celal Kucuker’s analysis of the Cup & Handle pattern maps out an explosive trajectory. Should critical support levels hold—particularly around the $0.95 mark—XRP could target intermediary milestones at $1.50 and $3.66, with a macro target reaching the 1.618 Fibonacci Extension level near $14.10.
- Downside Risks: Both analysts caution that a failure to hold immediate support zones could invalidate short-term bullish setups, potentially exposing the asset to deeper retracements down to the $0.48–$0.70 range before any sustainable recovery takes hold.
Chronology: How the Current Setup Unfolded
To understand the weight of these technical predictions, it is necessary to trace the chronology of XRP’s recent price action and the sequential discoveries made by market analysts.
The 2024 Precedent
The foundation of Blacksea’s current thesis lies in the market mechanics of 2024. During that period, XRP experienced prolonged consolidation. The digital asset was trapped in a descending channel characterized by narrowing trendlines, driving frustration among retail holders.

On multiple occasions, the price tested the patience of market participants by dipping below key moving averages. However, the defining moment occurred when XRP slipped just below the lower boundary of its falling wedge pattern. In technical analysis, this is frequently interpreted as a bear trap or false breakdown. Whales and institutional players often capitalize on these moments to sweep liquidity. Following that artificial breakdown, buyers stepped in en masse, sparking a massive 600% rally that shattered previous local resistance and drove the token past the $1.50 threshold.
The June 2026 Discovery
Fast forward to early June 2026, and history appeared to be rhyming. On June 6, Blacksea published a detailed market update pointing out that XRP had once again formed an identical falling wedge structure on its charts. The cryptocurrency had been oscillating between descending resistance and support lines, mirroring the exact price compression seen prior to the 2024 explosion.
Simultaneously, analyst Celal Kucuker brought a broader macro perspective to light by identifying a developing Cup & Handle formation. Kucuker noted that while the structural integrity of the chart remains sound on higher timeframes, the immediate path forward requires patience, as the asset must navigate a near-term correction phase to establish a durable market bottom.
Supporting Data: Technical Indicators and Fibonacci Projections
Market analysis in the digital asset space relies heavily on historical correlations, volume profiles, and mathematical extensions. The current forecasts for XRP are underpinned by specific data points gathered from TradingView charts and historical price actions.
+-------------------------------------------------------------------------+
|                        XRP PRICE TARGET MATRIX                          |
+---------------------+-----------------------+---------------------------+
| Phase / Milestone   | Projected Price Level | Potential ROI from $0.95  |
+---------------------+-----------------------+---------------------------+
| Immediate Support   | $0.90 – $0.95         | Base Foundation           |
| Short-Term Target   | $1.50                 | ~57% Upside               |
| Mid-Term Target     | $3.66                 | ~285% Surge               |
| Macro Fibonacci Ext.| $14.10                | ~1,378% Parabolic Rally   |
+---------------------+-----------------------+---------------------------+
The Anatomy of the Falling Wedge
A falling wedge is historically recognized as a bullish continuation or reversal pattern. It forms when the price makes lower highs and lower lows within a contracting range defined by two downward-sloping lines. As the lines converge, trading volume typically diminishes, indicating that selling pressure is exhausting itself.
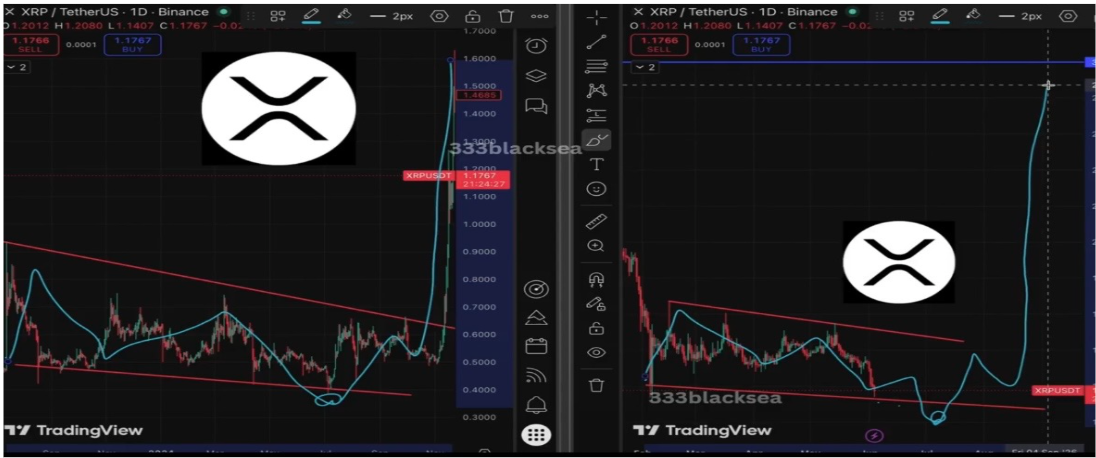
In XRP’s case, the compression inside this wedge has created a pressurized environment. Blacksea’s data indicates that as long as the asset respects the internal boundaries of the pattern—even if it breaches the lower trendline temporarily—the probability of a sharp, impulsive breakout remains elevated.
Fibonacci Extensions and the $14 Horizon
Kucuker’s deployment of Fibonacci extension tools provides a roadmap for the asset’s potential ceiling in an extended bull run. By measuring the depth of the Cup & Handle pattern’s bowl and projecting it upward from the breakout point, technical targets naturally align with key Fibonacci ratios.
- The 1.618 Extension: This level is widely watched by algorithmic traders and technical analysts as the "golden ratio" target for macro trend completions. In this scenario, reaching the 1.618 Fibonacci Extension places XRP at approximately $14.10.
- Intermediate Steps: Before reaching double digits, the token must successfully clear resistance zones at $3.66 (representing a roughly 282% gain from the $0.95 baseline) and handle psychological barriers around the $2.00 mark.
Market Implications and Risk Management
While the technical blueprints outlined by Blacksea and Kucuker paint an exceptionally optimistic picture for XRP holders, the broader market implications require a balanced evaluation of risk and reward.
Ending the Ongoing Downtrend
For months, XRP has labored under a persistent downtrend, frustrating long-term investors who watched other digital assets record significant capital inflows. A successful validation of the falling wedge or the Cup & Handle pattern would fundamentally alter this macro narrative. It would signal a definitive shift from distribution to accumulation, injecting fresh confidence into the ecosystem and potentially drawing institutional capital back into XRP-focused investment products.
The Threat of Invalidation
Technical patterns are probabilities, not guarantees. Both analysts have explicitly warned about the downside risks should the support structures fail.
- A breakdown below the $0.90–$0.95 support zone could trigger a cascade of long liquidations.
- If the price plunges deeper toward the $0.48 region, the current bullish thesis would be largely invalidated, resetting the multi-year chart structure and forcing market participants to wait through an extended period of re-accumulation.
Investor Strategy: Early Positioning vs. Caution
Given the high-beta nature of cryptocurrencies, timing is everything. Analysts are advising market participants to avoid emotional trading driven by FOMO (Fear Of Missing Out). Instead, professional traders are encouraged to:
- Monitor Support Zones: Watch how XRP behaves around the $1.00 psychological level and the critical $0.95 support floor.
- Prepare for Shakeouts: Anticipate high volatility, including potential fakeouts below trendlines designed to trap leveraged long positions.
- Execute Risk Management: Implement stop-loss parameters to protect capital against unexpected macroeconomic shocks or pattern failures.
Conclusion
As XRP continues to trade tightly within its established technical structures, the digital asset stands at a critical crossroads. On one hand, the convergence of historical falling wedge analogs and macro Cup & Handle formations points toward the possibility of a historic, parabolic price expansion reaching well into double digits. On the other hand, the immediate path is fraught with vulnerability, requiring the asset to weather potential shakeouts and hold crucial support lines.
Whether XRP can successfully replicate its 2024 heroics and embark on a renewed bullish super-cycle remains to be seen. However, for vigilant investors and chart technicians, the current market compression suggests that a major volatility event—and a directional breakout—may not be far off.