

XRP Hits Record Low Monthly RSI Amid Wider Crypto Market Downturn: A Comprehensive Market Analysis
Main Facts
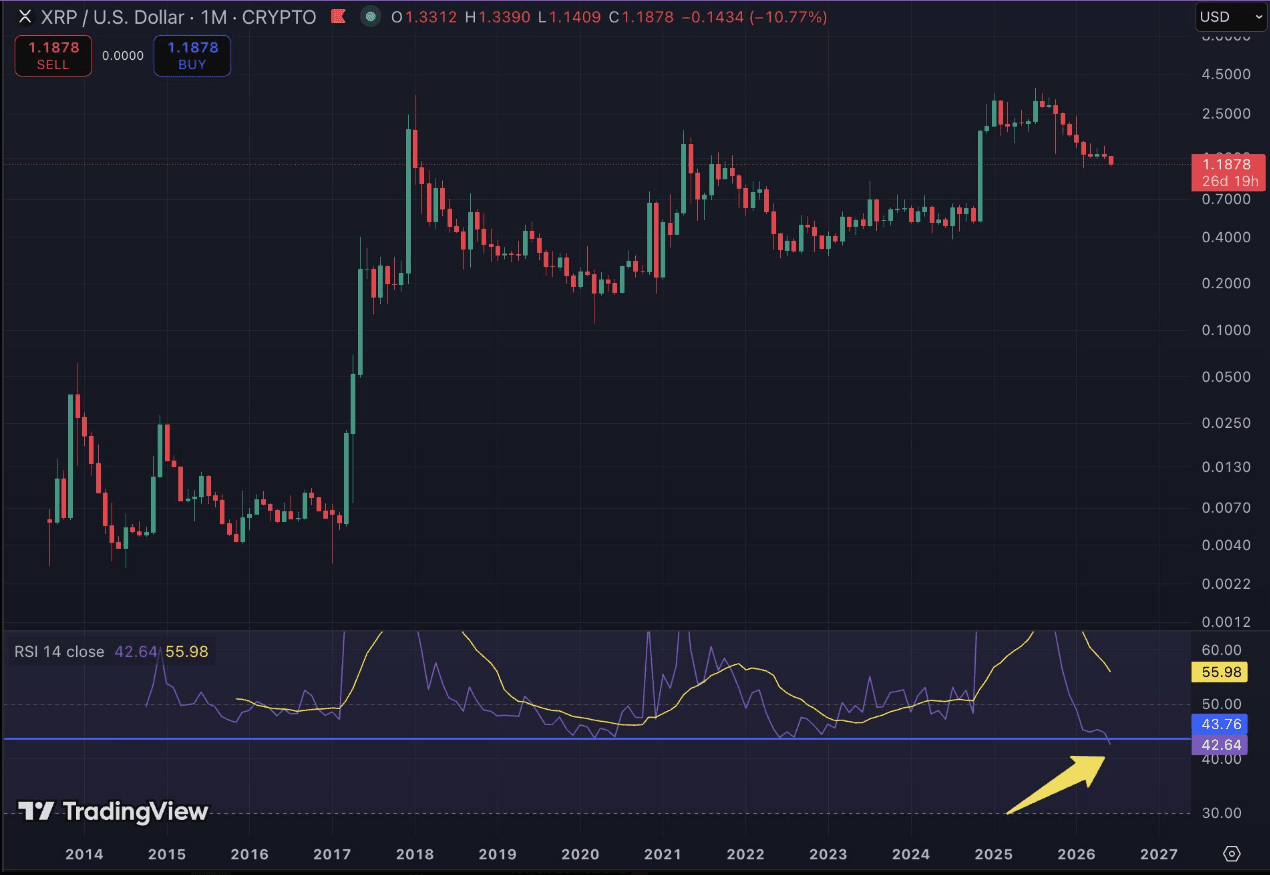
The digital asset market is experiencing a period of intense macro and microeconomic volatility, with Ripple’s XRP taking center stage due to a historic technical development. According to recent market data, XRP’s monthly Relative Strength Index (RSI) has plunged to an unprecedented 41.64. This figure marks the lowest monthly reading ever recorded for the token in its history, undercutting even the grim milestone of 43.75 set in March 2020. During that period, the broader cryptocurrency sector was plunged into one of its worst bear markets in history, catalyzed by pandemic-induced panic, pushing XRP down to a cycle floor of $0.11.
At the time of writing, XRP is exchanging hands at approximately $1.10 to $1.11, down significantly from its impressive multi-year peak of $2.84 reached in October 2025. This persistent, multi-month downward trajectory has erased billions of dollars in market capitalization, shrinking the token’s valuation from $82.5 billion at the start of the week down to approximately $69 billion—a steep 15% contraction in a matter of days.
While technical analysts and community commentators are sounding alarm bells over the severity of this oversold condition, structural caveats remain. The monthly candle for June is still open, meaning this reading is not yet etched in stone. Market analysts point out that a decisive recovery above the $1.30 threshold prior to the end of the month could rapidly alter the monthly RSI trajectory, potentially invalidating what some fear is a deeply bearish continuation signal. Nevertheless, the sheer velocity of the recent sell-off has highlighted deep structural weakness and capital flight from the asset over the last several quarters.
Chronology of Events
To understand how XRP reached this critical historical juncture, it is vital to trace the timeline of price action, sentiment shifts, and technical milestones that have defined the token’s trajectory over the past several years:
- March 2020: The COVID-19 black swan event rattles global financial markets. XRP hits what was previously its lowest recorded monthly RSI of 43.75, bottoming out at a cycle low of $0.11.
- April 2021 to November 2024: Following the March 2020 lows, XRP embarks on a multi-year macro cycle characterized by higher lows. A massive late-cycle surge in November 2024 drives the token to $3.40, marking an astonishing 580% gain from its October 2024 cycle low.
- October 2025: XRP reaches a local cycle high of $2.84, outperforming several expectations before entering a prolonged, grinding corrective phase that lasts well into mid-2026 without any notable structural relief rallies.
- Early June 2026: Market-wide pressures compound. Bitcoin faces sharp downward momentum, shedding vital support levels as macroeconomic anxieties mount and high-profile institutional asset sales hit the tape.
- June 4, 2026: Prominent XRP community commentator Austin publicly flags a historic technical breakdown on social media platform X (formerly Twitter). His charts reveal that XRP’s monthly RSI has slipped to 42.64 as prices degrade to $1.18.
- Mid-June 2026: Continued selling pressure drags the spot price down to $1.11, pulling the monthly RSI down further to its ultimate record low of 41.64. Concurrently, the total cryptocurrency market capitalization hemorrhages $330 billion within a single week.
Supporting Data and Technical Metrics
To properly contextualize the current state of XRP, market participants must examine the underlying quantitative data driving these metrics. The RSI is a momentum oscillator developed by J. Welles Wilder that measures the speed and magnitude of recent price changes to evaluate overvalued or undervalued conditions in the price of a stock or other asset. Traditionally, an RSI reading below 30 is widely recognized as signaling deeply "oversold" territory, while a reading above 70 indicates "overbought" conditions.
However, historical context matters significantly when analyzing macro timeframes like the monthly chart. XRP’s current monthly RSI reading of 41.64 technically sits above the traditional sub-30 oversold threshold. Despite this, within the historical context of XRP’s specific trading history, it represents the absolute weakest momentum reading the asset has ever posted.

This record-low momentum is mirrored in the token’s valuation metrics:
- Drawdown from Peak: Trading at $1.10, XRP is currently sitting roughly 61% below its October 2025 high of $2.84.
- Market Capitalization Erosion: The asset’s market cap has fallen to approximately $69 billion, erasing nearly $13.5 billion in value in a single week.
- Price Retracement: The current price range revisits valuation floors last defended by bulls in early February of the same year.
- Broader Market Contagion: The wider digital asset ecosystem suffered a $330 billion market cap loss over a seven-day window, demonstrating that XRP’s decline is occurring within an environment of systemic capital withdrawal rather than isolated project-specific failure.
Official Responses and Community Reactions
As technical charts flashed warning signs across crypto-Twitter and institutional analytics terminals, market participants, analysts, and commentators weighed in on the significance of the move.
The alarm was first raised by prominent XRP community analyst Austin (@Austin_XRPL), who published initial charting data on June 4, 2026. Highlighting the gravity of the technical structure, Austin noted on social media: "XRP is the most oversold on the monthly time frame that it has EVER been." His initial post captured the metric at 42.64 when the token traded at $1.18, a threshold that was subsequently breached as further market-wide liquidations pushed prices down to $1.11.
While retail and community sentiment has leaned heavily into discussions regarding historical cycle analogies, institutional onlookers have remained focused on external macroeconomic catalysts. The broader market sell-off was heavily exacerbated by developments surrounding Strategy (the corporate entity historically associated with Michael Saylor). Confirmation that the firm liquidated a minor portion of its holdings—specifically selling 32 BTC from its colossal reserve of over 800,000 Bitcoin—sent psychological shockwaves through over-leveraged derivatives markets.
This corporate maneuver, combined with Bitcoin slipping toward the crucial $63,000 threshold, triggered widespread liquidations across altcoin markets, dragging high-beta assets like XRP down alongside top-tier cryptocurrencies. Major market-making desks and research publications have since noted that digital asset liquidity remains thin, amplifying volatility and creating exaggerated technical extremes such as XRP’s record-low monthly RSI print.
Implications for Investors and Future Outlook
The convergence of a record-low monthly RSI and a broader crypto market contraction carries profound implications for short-term traders and long-term investors alike.
Historical Precedents: A Bullish Reversal or Further Pain?
Market historians are looking closely at the parallels between the current market structure and the March 2020 capitulation event. During that cycle, the extreme monthly RSI low marked the absolute structural macro bottom for XRP. Following that dark period, the token established a formidable base, printing a series of higher lows that ultimately propelled it to a cycle high of $1.96 in April 2021, and subsequently to $3.40 in November 2024—a massive 580% expansion from its cycle lows.
Proponents of a bullish reversal argue that extreme technical oversold conditions on macro timeframes frequently present generational accumulation opportunities for patient capital. If historical rhythms repeat, the current flush-out could be violently clearing out weak hands and leveraged long positions ahead of the next major expansionary phase.
The Bearish Caveat: Structural Invalidation Risks
Conversely, seasoned market analysts urge caution, emphasizing that history does not always repeat identically. The immediate hurdle for XRP bulls is the remainder of the June trading month. Because the monthly candle remains open, the 41.64 RSI reading is provisional. If macroeconomic conditions stabilize and XRP mounts a relief rally reclaiming the $1.30 mark before the month concludes, the monthly RSI will print significantly higher, entirely neutralizing the current bearish/oversold technical warning signal.
However, failure to reclaim key psychological and technical levels—such as the $1.20 and $1.30 zones—could open the door to prolonged range-bound consolidation or a test of deeper historical supports. With the total crypto market cap losing hundreds of billions of dollars in days, macro headwinds, regulatory uncertainty, and shifting institutional risk appetites will ultimately dictate whether XRP’s record-low RSI serves as the springboard for a historic recovery or merely a milestone on a longer road of structural correction.