
Technical Analysis: Bitcoin Eyes Potential Bullish Reversal Toward $69,000 as Classic Chart Pattern Forms
Main Facts: The $69,000 Target and the Inverse Head-and-Shoulders Setup
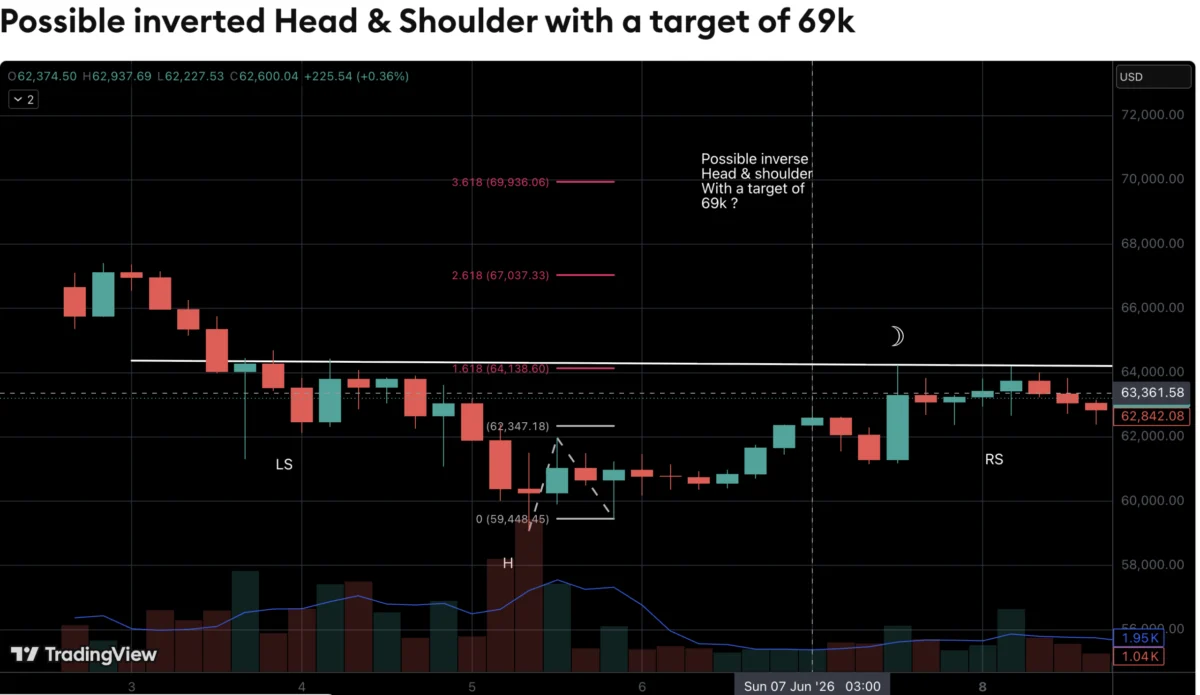
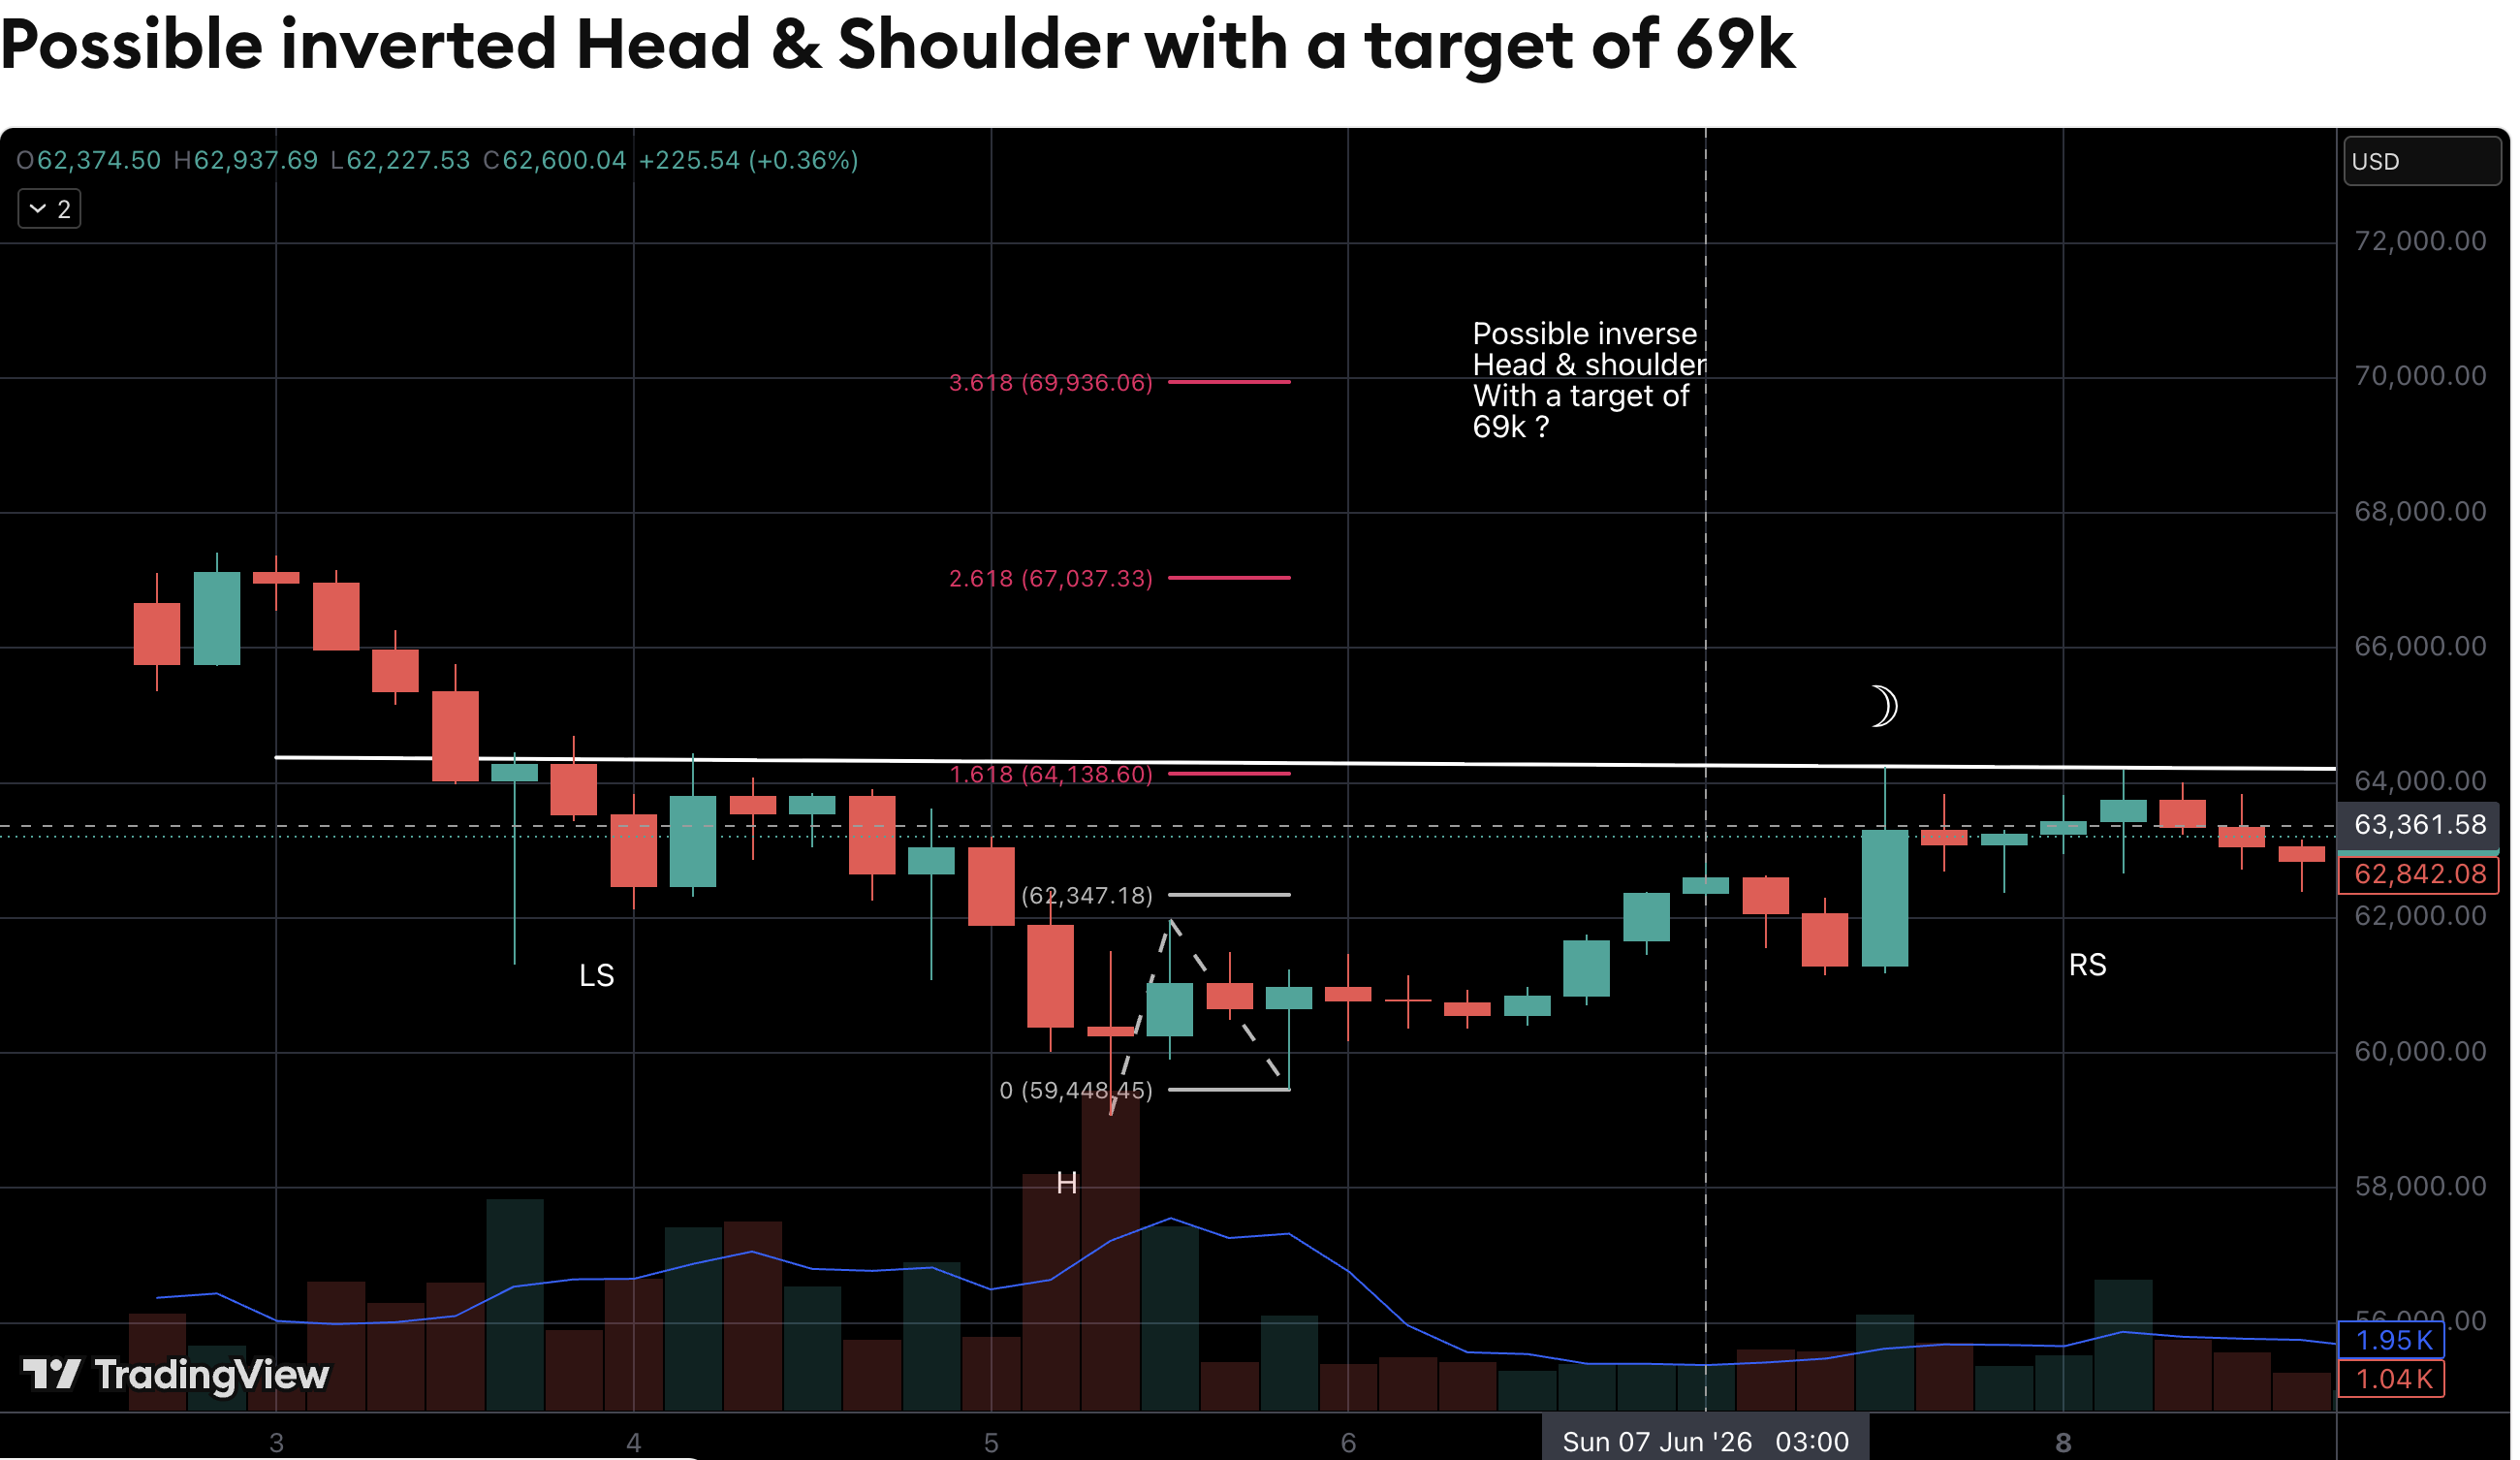
A detailed technical analysis published on TradingView has sparked optimism across the cryptocurrency market, pointing to a classic bullish reversal pattern on the Bitcoin (BTC/USD) daily chart. The analysis, shared by prominent TradingView contributor fibsrus, highlights the formation of a potential inverse head-and-shoulders (iH&S) pattern. If validated, this classic chart structure projects a macro upside target of approximately $69,000—a level that has historically served as both a psychological milestone and a major area of previous market cycles’ resistance.
                  [Neckline Resistance Zone] ~ $63,000 - $64,000
                       /
                      /
        [Left Shoulder]                           [Right Shoulder]
         Support: ~$60,500                         Support: ~$59,400 (CRITICAL)
                                                     /
                                                    /
                             [Head]                /
                 _______ Support: ~$56,500 _______/
An inverse head-and-shoulders pattern is highly regarded in classical technical analysis as one of the most reliable trend-reversal indicators. It typically signals the exhaustion of a markdown phase and the transition of control from sellers to buyers. The structure consists of three distinct troughs: a left shoulder, a deeper trough forming the head, and a final, shallower trough forming the right shoulder.
However, market analysts urge caution, emphasizing that the setup remains speculative until a formal breakout occurs. For this pattern to transition from a theoretical setup to an active bullish signal, Bitcoin must secure a decisive breakout and a daily candle close above the "neckline" resistance level.
Conversely, the analysis establishes a strict invalidation threshold. The low of the right shoulder, situated around $59,400, represents the line in the sand for bulls. A daily close below this support level would invalidate the structure, signaling that buyers have failed to maintain control and opening the door to further downside.
Chronology: How the Pattern Developed
The emergence of this technical pattern is the result of several weeks of volatile price discovery, during which Bitcoin underwent a series of corrections, liquidations, and subsequent accumulations. To understand how the market reached this critical juncture, it is essential to trace the asset’s trajectory over the preceding months.
Timeline of Pattern Development:
+-------------------+---------------------------------------------------------+
| Phase             | Market Action & Price Levels                            |
+-------------------+---------------------------------------------------------+
| Left Shoulder     | Price drops to ~$60,500; initial relief rally fails     |
| (Mid-Spring)      | at the neckline (~$63,500).                             |
+-------------------+---------------------------------------------------------+
| The Head          | Deeper correction driven by macro fears; capitulation   |
| (Early Summer)    | bottom established at ~$56,500.                         |
+-------------------+---------------------------------------------------------+
| Right Shoulder    | Recovery followed by a shallow pullback; buyers defend  |
| (Late Summer)     | the critical $59,400 floor.                             |
+-------------------+---------------------------------------------------------+
| Neckline Test     | BTC approaches the breakout zone (~$63,000 - $64,000)   |
| (Current Phase)   | with declining volume, awaiting a volatility catalyst.  |
+-------------------+---------------------------------------------------------+
Phase 1: The Formation of the Left Shoulder
Following a period of distribution at higher levels, Bitcoin experienced a sharp downward impulse. Selling pressure drove the price down to find initial support around the $60,500 region. A brief relief rally followed, pushing the asset back up to test overhead supply, which established the initial boundary of the pattern’s "neckline" near the $63,500 mark. This completed the structure of the left shoulder.
Phase 2: The Capitulation and Formation of the Head
The relief rally proved temporary as macroeconomic headwinds and spot-market liquidations triggered a secondary, deeper sell-off. This capitulation event pushed Bitcoin past the previous support of the left shoulder, plunging the asset to a local bottom of approximately $56,500. This flush-out successfully cleansed leveraged long positions from the derivatives market, establishing the "head" of the pattern. Buying interest quickly returned at these discounted levels, prompting a sharp V-shaped recovery back toward the neckline resistance zone.
Phase 3: Consolidating the Right Shoulder
Upon retesting the neckline resistance, Bitcoin once again faced selling pressure, but this time the retracement was notably shallower. Buyers stepped in aggressively at $59,400, preventing the asset from retesting the lows of the head. This higher low formed the right shoulder, signaling a structural shift from a sequence of lower lows to a potential higher-low trend.
Supporting Data: Volume, On-Chain Metrics, and Macro Catalysts
For classical chart patterns to carry statistical weight, they must be validated by secondary technical and fundamental indicators. Analysts point to three primary data pillars that support or challenge the validity of this inverse head-and-shoulders pattern: volume dynamics, on-chain accumulation trends, and macroeconomic liquidity indicators.
1. Volume Profile Analysis
In classical technical theory, volume should follow a specific smile-like curve during the formation of an inverse head-and-shoulders pattern:
- Left Shoulder: High volume on the decline.
- Head: Diminishing volume on the final capitulation, indicating seller exhaustion.
- Right Shoulder: Notably low volume during the consolidation phase.
- Breakout: A massive surge in volume as the price penetrates the neckline.
Currently, Bitcoin’s volume profile aligns with these classical rules. Trading volume has dried up during the consolidation of the right shoulder, suggesting that sellers are unwilling to part with their assets at current prices. However, the crucial final step—a high-volume breakout above the neckline—has yet to materialize.
2. On-Chain Metrics: The Accumulation Trend Score
Data from on-chain analytics firm Glassnode reveals that during the formation of the right shoulder, the Accumulation Trend Score for Bitcoin transitioned back toward a value of 1.0. This score indicates that larger entities, often referred to as "whales" or institutional holders, are actively accumulating coins rather than selling.
Glassnode Accumulation Trend Score (Scale: 0.0 - 1.0)
[0.0] Distribution (Selling) <--------------------> [1.0] Accumulation (Buying)
                               Current State: ~0.85 (Strong Buying)
Furthermore, exchange reserve data shows a steady decline in the balance of BTC held on spot exchanges, reaching multi-year lows. This supply-side illiquidity suggests that if a breakout occurs, the lack of immediate sell-side liquidity could accelerate the price move toward the $69,000 target.
3. Macroeconomic Liquidity Indexes
Cryptocurrency markets do not operate in a vacuum. Bitcoin’s price movements remain highly correlated with global liquidity cycles, particularly the expansion and contraction of the global M2 money supply.
Recent monetary policy shifts, including interest rate cuts by major central banks such as the Federal Reserve and the European Central Bank, have historically paved the way for capital inflows into risk-on assets. A rising Global Liquidity Index (GLI) often acts as the wind beneath the wings of bullish chart patterns, increasing the probability of a successful breakout rather than a failed deviation.
Official Responses and Expert Opinions
While technical setups offer structured frameworks, institutional market makers and veteran analysts express varying degrees of caution regarding retail interpretations of chart patterns.
The Skeptical View: Algorithmic Markets and Liquidity Sweeps
Several institutional derivatives traders warn that retail chart patterns are frequently exploited by automated high-frequency trading (HFT) algorithms.
"The inverse head-and-shoulders is one of the most visible setups in the market," noted a senior market maker from a prominent digital asset liquidity firm. "Because retail traders place their stop-loss orders just below the right shoulder at $59,400, these areas become highly attractive targets for liquidity sweeps. It is entirely possible for the price to briefly wick below $59,400 to trigger sell stops before reversing violently upward. Traders must wait for daily close confirmations rather than intraday movements."
The Bullish Consensus: A Solid Risk-to-Reward Ratio
Conversely, market analysts emphasize that the utility of this pattern lies not in its predictive certainty, but in its mathematical clarity.
In a statement addressing the setup, technical analyst fibsrus explained:
"No pattern is a guarantee. However, what this structure gives us is a highly defined risk-to-reward framework. If you enter near the current consolidation with a stop-loss set just below the right shoulder support at $59,400, your risk is minimal compared to the potential upside of a run to $69,000. It is a textbook trade setup from a risk-management perspective."
Implications: The Macro Outlook for Bitcoin and Altcoins
The resolution of this pattern will likely dictate the direction of the broader cryptocurrency market for the remainder of the quarter.
                  +-----------------------------------------+
                  |  Neckline Breakout (~$63,000 - $64,000) |
                  +--------------------+--------------------+
                                       |
                     +-----------------+-----------------+
                     |                                   |
            [YES: Daily Close Above]            [NO: Rejection/Break Below]
                     |                                   |
                     v                                   v
         +-----------------------+           +-----------------------+
         | Target: $69,000       |           | Target: $59,400       |
         | Altcoin Surge (L1s)   |           | Liquidity Sweep Zone  |
         | Institutional Inflows |           | Bearish Momentum      |
         +-----------------------+           +-----------------------+
Scenario A: A Successful Breakout above the Neckline
If Bitcoin secures a daily close above the neckline resistance (typically identified between the $63,000 and $64,000 levels), it would likely trigger a cascade of buy-stop orders and short-coverings. This momentum could quickly carry the asset toward the measured target of $69,000.
A move of this magnitude would likely reignite retail interest and accelerate inflows into spot Bitcoin ETFs. Additionally, a strong Bitcoin breakout often boosts market sentiment, leading to capital rotation into high-beta altcoins, particularly major Layer-1 protocols and liquid staking assets.
Scenario B: Invalidation and a Break below $59,400
Should Bitcoin fail to maintain its footing and break below the critical $59,400 support zone, the bullish thesis would be invalidated. Such a breakdown would indicate that the right shoulder has collapsed, signaling that sellers remain in control.
This scenario would likely force a retest of the "head" support at $56,500, with a risk of extending losses toward the macro support levels of $53,000 to $50,000. Altcoins would likely experience deeper corrections in this environment, as capital flees back into stablecoins or cash.
For now, Bitcoin remains in a consolidation phase, balanced between a defined bullish trigger and a clear invalidation level. Market participants are advised to monitor volume trends and daily close confirmations to determine whether this classical pattern will deliver a bullish breakout or serve as a lesson in market patience.