XRP Hits Historic RSI Low: A Technical Crossroads Amid Market Turbulence
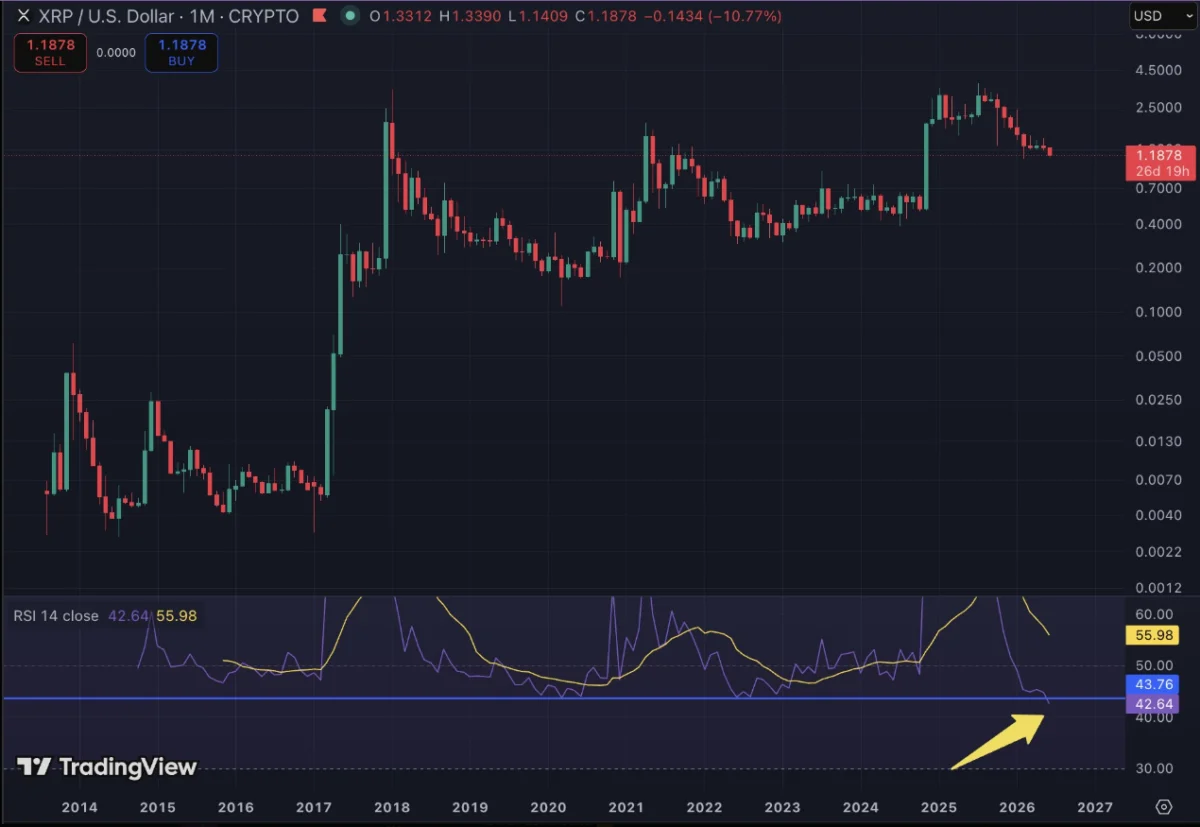
The digital asset landscape is currently witnessing a historic technical development for XRP, as the token’s monthly Relative Strength Index (RSI) has plummeted to 41.64. This figure represents the lowest reading ever recorded for the asset on a monthly timeframe, eclipsing the previous benchmark of 43.75 set in March 2020. During that period, the cryptocurrency market faced a catastrophic liquidity crunch, with XRP bottoming out at a mere $0.11. As the current market environment experiences significant volatility, analysts are closely monitoring this RSI milestone, debating whether it serves as a harbinger of a structural bottom or a sign of deeper, sustained weakness.
A Signal With A Significant Caveat
While the current RSI of 41.64 is statistically unprecedented for XRP, technical analysts urge caution regarding its finality. Because the monthly candle for June has not yet closed, the indicator remains in a state of flux. Market data suggests that the RSI is highly sensitive to the closing price of the asset at the end of the month. Should XRP manage a recovery to price levels above $1.30 by the end of June, the RSI would likely rebound significantly, effectively neutralizing the signal and stripping it of its bearish—or potentially oversold—implications.
The alarm was first raised by a prominent XRP community commentator known as "Austin," who has been tracking the decline with forensic precision. In his initial analysis, Austin highlighted that the RSI had dipped to 42.64 as the token slid toward $1.18. As downward pressure persisted and the price retreated further to approximately $1.11, the indicator adjusted accordingly to its current historic low. This decline is part of a broader, protracted slump; XRP is currently trading roughly 61% below its October 2025 peak of $2.84, having failed to establish a meaningful recovery trajectory for several months.
Chronology: From Peak Performance to Current Stagnation
To understand the weight of this technical signal, one must contextualize the timeline of XRP’s recent performance. The current malaise follows a significant period of optimism. In late 2025, the asset reached a high of $2.84, buoyed by favorable market conditions and renewed institutional interest. However, since that peak, the asset has entered a period of persistent distribution.
- October 2025: XRP reaches a local peak of $2.84, marking a cycle high.
- Late 2025 – Early 2026: A steady decline begins, characterized by lower highs and a lack of sustained buying volume.
- February 2026: XRP price levels touch early-year support zones before briefly stabilizing.
- June 2026: The monthly RSI breaches the historic 2020 floor, signaling extreme exhaustion on a multi-year basis.
This chronology underscores a shift in investor sentiment. The market has moved from a state of accumulation and growth to one of caution, as evidenced by the rapid shedding of market capitalization. Within the first week of June 2026 alone, XRP’s market cap eroded from $82.5 billion to approximately $69 billion—a decline of roughly 15%.

Supporting Data: The Broader Market Context
The plight of XRP cannot be viewed in a vacuum. The entire cryptocurrency ecosystem has faced severe headwinds this week, contributing to the downward momentum. The broader market capitalization of the crypto sector shed approximately $330 billion in value over a seven-day span.
A significant catalyst for this sentiment shift was the recent activity of Strategy, a firm associated with Michael Saylor. Despite the firm’s massive Bitcoin reserves—exceeding 800,000 BTC—the confirmation that the company sold a nominal 32 BTC sent ripples of uncertainty through the market. While the sale was mathematically insignificant relative to the total supply, the symbolic impact on market psychology was palpable. Bitcoin, the industry’s bellwether, retreated toward the $63,000 support level, forcing altcoins like XRP to navigate a risk-off environment where capital flight has become the primary trend.
Furthermore, it is essential to define what the RSI represents. The Relative Strength Index is a momentum oscillator that measures the speed and change of price movements. Traditionally, an RSI reading below 30 is classified as "oversold," suggesting that the asset has been punished excessively by sellers and may be ripe for a mean reversion. XRP’s current reading of 41.64 is significantly above that "oversold" threshold, yet its relative historical standing suggests that for this specific asset, momentum is at an all-time low. This highlights a divergence between traditional indicator benchmarks and asset-specific historical behavior.
Historical Precedent and Future Implications
The 2020 episode remains the most cited point of comparison for investors attempting to predict a pivot. In that instance, the RSI bottom aligned perfectly with the price floor of the cycle. Following that bottom, XRP engaged in a series of higher lows, eventually climbing to $1.96 by April 2021. Even more impressively, a subsequent bull cycle in November 2024 saw the token reach $3.40, a gain of approximately 580% from its prior lows.
If history is to repeat, the current RSI low could be interpreted by contrarian investors as a "buy signal." However, the structural differences between 2020 and 2026 are substantial. The macroeconomic environment—characterized by fluctuating interest rates, regulatory scrutiny, and changing institutional demand—differs significantly from the liquidity-heavy environment of the post-2020 recovery.
Analyst Perspectives and Market Sentiment
The sentiment within the XRP community remains bifurcated. On one side, technical purists view the RSI drop as an indictment of the current price action, warning that without a swift reclamation of key resistance levels, the token could face further capitulation. On the other side, "HODLers" and long-term proponents point to the token’s resilience during previous bear markets as evidence that current prices represent a generational buying opportunity.
"XRP is the most oversold on the monthly time frame that it has EVER been," Austin noted in his social media discourse, acknowledging that while the data is historically dire, it also highlights the extreme extent to which the token has been liquidated.
The implications of this RSI reading are twofold:
- The Case for Rebound: Should the market find support, the "oversold" nature of the token could act as a spring. Investors often look for extreme RSI readings to enter long positions, expecting a snap-back effect that can lead to rapid price appreciation.
- The Case for Continued Weakness: If the RSI continues to grind lower throughout the remainder of the month, it may suggest that the previous historical floors are not as robust as once thought. A failure to hold current levels could lead to a breach of support that invites further algorithmic selling.
Conclusion: Watching the June Candle
As June draws to a close, the focus for traders remains squarely on the monthly candle close. A recovery above the $1.30 threshold would effectively invalidate the current alarmist interpretation of the RSI, suggesting that the recent dip was merely a temporary volatility spike rather than a structural failure. Conversely, if the token continues to hover near $1.10, the technical outlook will remain clouded by this record-breaking RSI reading.
Ultimately, XRP stands at a critical juncture. While the data paints a picture of extreme momentum exhaustion, the history of the crypto market is defined by its ability to defy technical gravity. Whether this RSI reading marks the bottom of a painful correction or the beginning of a deeper downward trend is a question that will be answered by the market’s response to the current macro pressures and the closing of the monthly charts. Investors are advised to maintain a vigilant stance, monitoring not only the RSI but also the broader institutional movements that continue to dictate the pulse of the digital asset market.