XRP on the Brink: Analysts Identify Bullish Patterns Hinting at Triple-Digit Gains
The cryptocurrency market is currently fixated on a series of technical signals emerging from XRP, the digital asset native to the Ripple ecosystem. As market participants navigate a period of consolidation, prominent analysts have identified recurring chart structures that historically preceded massive, parabolic rallies. According to recent technical assessments, XRP is tracing a trajectory reminiscent of its 2024 breakout, leading some experts to project a potential shift from its current stagnant downtrend into a period of aggressive, explosive growth.
While the broader market remains cautious, the data points toward a "final shakeout" phase—a common market phenomenon where weak hands are forced out before a significant upward reversal. This analysis examines the technical confluence currently surrounding XRP, the historical context of its price patterns, and the long-term, high-value targets suggested by market experts.
The Technical Setup: A Repeat of 2024?
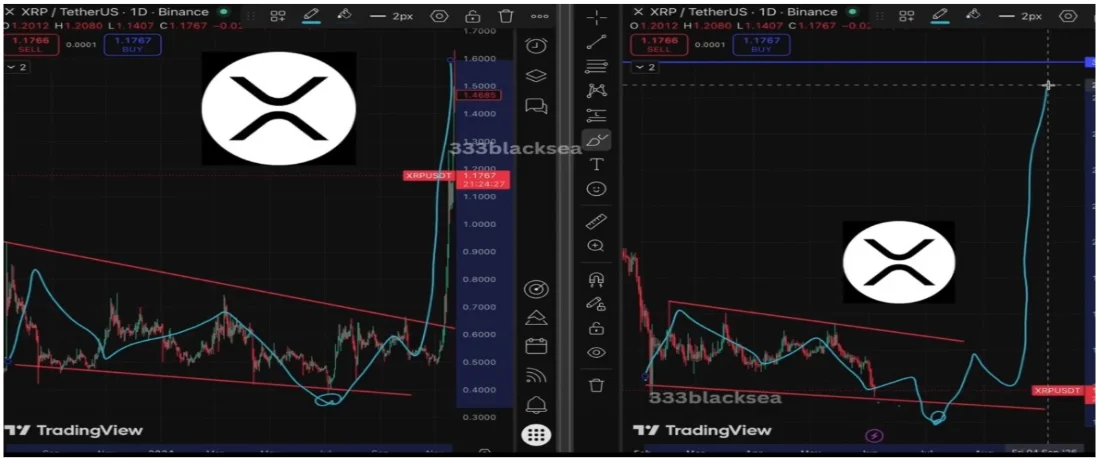
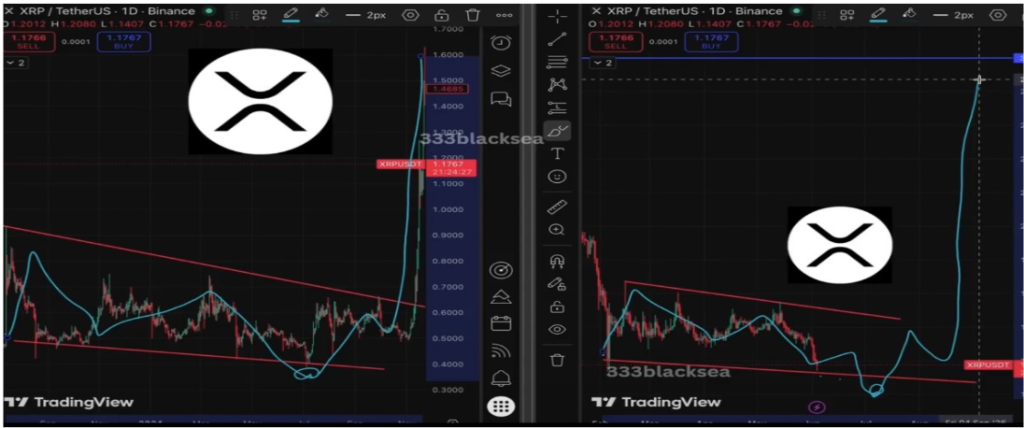
At the center of the current market debate is a technical formation known as the "falling wedge." Crypto analyst Blacksea recently highlighted this pattern, noting that it has largely gone unnoticed by the general retail market. A falling wedge is a bullish chart pattern that typically forms during a downward trend, characterized by two converging trendlines. As the price compresses within these lines, it often culminates in a breakout to the upside.
Historical Precedent and the 600% Surge
To understand the significance of the current structure, one must look back at the 2024 cycle. During that period, XRP displayed an identical falling wedge formation. At the time, the asset was hovering around the $0.50 price point. As the compression tightened, the price experienced a "false breakdown"—a scenario where the price slips beneath the support trendline to trap short sellers before snapping back with intense momentum. Following that shakeout, XRP embarked on a historic rally, surging by over 600% and clearing the $1.50 resistance level.
Current market data indicates that XRP is once again trapped within these tightening trendlines. The compression is palpable, with repeated price swings signaling that a major volatility event is imminent. Blacksea suggests that if history repeats, current holders may be witnessing the final moments of the consolidation phase before an aggressive bullish reversal takes hold.

Chronology of Market Sentiment and Technical Evolution
The recent movement of XRP has been defined by a struggle between bearish pressure and the underlying demand for the asset. Understanding the timeline of these developments is crucial for investors looking to gauge the likelihood of a breakout.
- Early 2024: XRP enters a prolonged consolidation phase, characterized by the formation of the initial falling wedge. Market sentiment remains skeptical as the asset struggles to find momentum.
- Mid-2024 Breakthrough: The "false breakdown" occurs. XRP dips below its support level, triggering stop-losses for short-term traders. This provides the liquidity needed for the subsequent 600% rally, which ultimately pushes the token toward the $1.50 threshold.
- Late 2025 – Early 2026: Following the rally, XRP enters a cooling-off period. The market experiences a classic retest of previous support levels, leading to the current setup.
- June 2026: Analysts like Blacksea and Celal Kucuker identify the emergence of a "secondary" bullish structure. While Blacksea focuses on the repeating falling wedge, Kucuker identifies a long-term "Cup & Handle" pattern that suggests a multi-stage breakout reaching into double digits.
Supporting Data: The Cup & Handle and Fibonacci Projections
While Blacksea’s analysis focuses on short-to-medium-term breakout signals, analyst Celal Kucuker has provided a broader, more ambitious roadmap for XRP. Kucuker’s analysis centers on the "Cup & Handle" pattern—a classic technical indicator often associated with long-term bullish reversals.
The Roadmap to $14
Kucuker’s forecast suggests that while the path to growth is significant, it may not be linear. His model predicts that the market could witness one final correction, potentially dragging the price down toward the $0.90 to $0.48 range. While this may appear bearish on the surface, Kucuker views it as a necessary structural foundation for the "Handle" of the pattern.
According to Kucuker’s projections based on the 1.618 Fibonacci Extension level:
- Phase One: A bounce from the $0.95 support zone.
- Phase Two: A rally toward $1.50, establishing a new local high.
- Phase Three: An acceleration toward $3.66, representing a 282% increase from the base support.
- The Ultimate Target: A push toward $14.10, which would represent a staggering 1,378% gain from the $0.95 support level.
These Fibonacci levels are not arbitrary; they represent key mathematical resistance and support zones that traders use to calculate potential profit-taking points. If the "Handle" completes successfully, the technical validity of these targets increases significantly in the eyes of institutional analysts.
Official Responses and Market Skepticism
It is important to note that technical analysis, while powerful, does not exist in a vacuum. Ripple, the company behind the XRP Ledger, has historically maintained a focus on utility, cross-border payments, and regulatory compliance rather than short-term price movements.
Official communications from Ripple leadership have consistently emphasized the long-term adoption of XRP in global finance. While they rarely comment on specific price patterns or chart setups, their efforts to secure regulatory clarity in various jurisdictions have arguably provided the fundamental backbone that allows technical patterns to play out.
Market skeptics, however, warn that technical patterns are not guarantees. Critics point to the inherent volatility of the crypto market, noting that "black swan" events—such as unexpected regulatory shifts or macroeconomic downturns—can invalidate even the most perfectly formed bullish patterns. They argue that the reliance on historical performance (such as the 2024 rally) may be a form of confirmation bias, failing to account for current changes in market liquidity and investor demographics.
Implications for Investors and Risk Management
The dual-narrative presented by Blacksea and Kucuker offers a compelling outlook for the future of XRP, but it carries clear implications for risk management.
The "Final Shakeout" Risk
The most critical takeaway for investors is the potential for a "final shakeout." Both analysts acknowledge that before an explosive rally occurs, the price often moves in the opposite direction. This is designed to shake out "weak hands"—investors who panic at the sight of a 10-20% drop. For long-term investors, this underscores the importance of conviction. However, for traders using leverage, these shakeouts are often where liquidation occurs.
Strategic Positioning
Given the current price action, the following considerations are essential for those looking to engage with the market:
- Dollar-Cost Averaging (DCA): Given the prediction of a potential drop to $0.90 or lower, a DCA strategy allows investors to accumulate positions without risking their entire capital on a single entry point.
- Risk-to-Reward Ratios: Investors should calculate their potential losses against the projected upside. If the target is $14, a small stop-loss near the $0.48 support level provides an asymmetric risk-to-reward ratio that many professional traders seek.
- Monitoring External Catalysts: Beyond technical patterns, investors should keep a close eye on news surrounding Ripple’s litigation, partnership announcements, and general Bitcoin price action, as these factors often act as the primary catalyst that triggers the movement described by technical analysts.
Conclusion: A Pivot Point for XRP
XRP currently stands at a junction that has historically signaled major trend shifts. Whether the asset follows the path of the falling wedge or the long-term Cup & Handle formation, the technical consensus is leaning heavily toward a bullish resolution.
The data suggests that the "downtrend" which has plagued XRP throughout the recent months is not necessarily a sign of terminal decline, but rather a necessary period of consolidation. If the market mirrors the mechanics of 2024, the current price action is merely the quiet before a significant storm. However, as with all investments in the digital asset space, patience and disciplined risk management remain the most effective tools for navigating the volatility that inevitably precedes a parabolic move.
As traders wait for the next breakout, the primary question remains: will the market have the strength to push through the resistance, or will the "final shakeout" claim those who were not prepared for the journey? Only time—and the next few weeks of market volume—will tell.
Disclaimer: This article is for informational purposes only and does not constitute financial advice. Cryptocurrency investments are subject to high volatility and risk. Always conduct your own research and consult with a certified financial advisor before making any investment decisions.