
Ethereum’s Historic RSI Reset: A Statistical Threshold or a Structural Breakdown?
In the volatile landscape of digital assets, few indicators command as much respect among veteran traders as the Relative Strength Index (RSI). As of June 2026, Ethereum (ETH) has plummeted below the critical $1,800 psychological support level, plunging to lows of $1,536. While the immediate price action has sparked a wave of bearish sentiment across the broader cryptocurrency market, a deeper examination of the monthly RSI reveals a phenomenon unprecedented in the asset’s history: the index has dropped to its lowest level since Ethereum’s inception in 2015.
This technical anomaly has ignited a fierce debate among analysts. Does this extreme oversold reading represent the final capitulation phase before a historic bull run, or does it signal a fundamental shift in the asset’s long-term viability?
Main Facts: The Anatomy of the 2026 Crash
The current downturn marks the culmination of a brutal nine-month correction. Since reaching an all-time high of $4,946 in August 2025, Ethereum has struggled to maintain momentum, falling nearly 70% from its peak. The recent breach of the $1,800 floor—a level that previously served as a robust support zone—has forced market participants to re-evaluate their exposure.
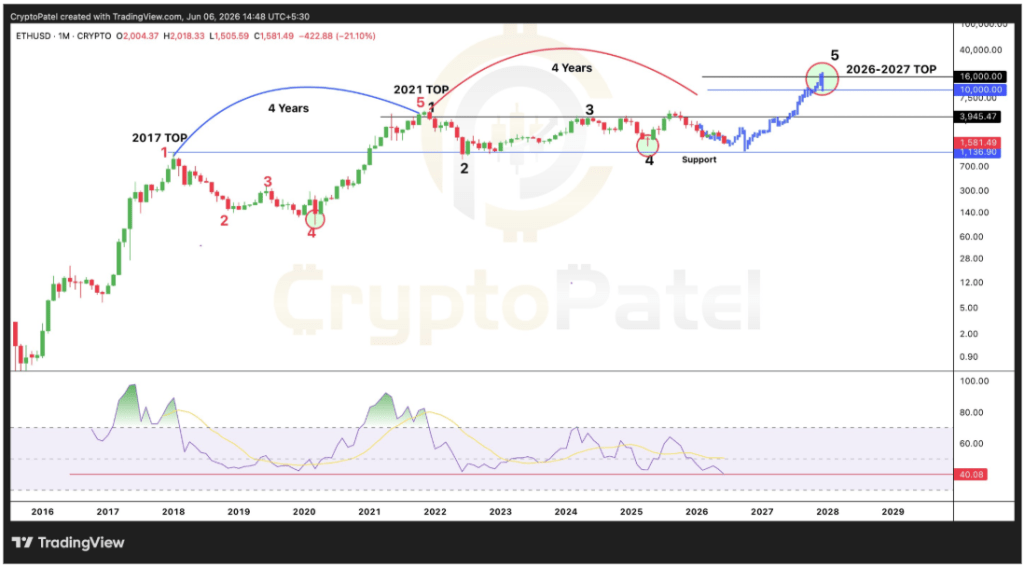
The most jarring aspect of this decline is the monthly RSI reading, which has now dipped to approximately 40. For the uninitiated, the RSI is a momentum oscillator that measures the speed and change of price movements. Traditionally, an RSI reading below 30 is considered "oversold," while readings above 70 are "overbought." While Ethereum has not technically breached the 30-mark on the monthly timeframe, the sheer speed and depth of the descent to 40 have created a statistical outlier. Never in the history of ETH has the monthly momentum chart looked this depleted, prompting comparisons to the most significant market bottoms of the last decade.
A Chronology of Ethereum’s Cyclical Nature
To understand the gravity of the current situation, one must look at the historical precedent. Ethereum has historically moved in distinct four-year cycles, often dictated by the broader Bitcoin halving schedule and subsequent market liquidity shifts.
The 2020 Recovery Phase
In 2020, following the global liquidity crisis, Ethereum’s RSI reached a depressed level that mirrored the current setup. At the time, the price hovered near $88. Skepticism was rampant, and many pundits predicted the death of the smart contract platform. Instead, the RSI reset acted as a springboard, launching Ethereum into a parabolic trajectory that saw it peak above $4,800 by 2021.
The 2022 Capitulation
History repeated itself in 2022. Following the collapse of major industry players, Ethereum’s RSI bottomed out again, setting the stage for a recovery from the $880 level. This accumulation phase proved vital for long-term investors, as the subsequent relief rally provided the foundation for the record-breaking peaks observed in 2025.

The 2026 Context
We are now witnessing the third major test of this "RSI Reset" theory. Unlike previous cycles, however, the macroeconomic environment is significantly more complex. With high interest rates, shifting regulatory landscapes, and the maturation of institutional investment vehicles, the market is no longer the "Wild West" it was in 2015 or 2020. Yet, the price action remains remarkably consistent with historical patterns, suggesting that despite external changes, human psychology and market exhaustion cycles remain constant.
Supporting Data: ETF Inflows and Market Liquidity
The price of Ethereum does not exist in a vacuum. It is heavily influenced by the flow of capital through institutional gateways, most notably the Spot Ethereum ETFs. These financial instruments were designed to provide stability and mainstream adoption, but recent data suggests they are acting as a mirror to market sentiment rather than a floor for prices.
On Thursday, June 4, the industry saw a glimmer of hope when Spot Ethereum ETFs recorded $19 million in net inflows, breaking a 17-day streak of outflows. Analysts hoped this signaled the return of institutional appetite. However, the relief was short-lived. By Friday, the sentiment reversed once more, resulting in $5.97 million in net outflows. This "tug-of-war" between retail panic and institutional hesitation is currently defining the $1,600 price region.
For the bulls, the immediate mandate is clear: they must defend the $1,600 support zone with significant, sustained inflows. A failure to hold this level could trigger a wave of liquidations, potentially pushing the price toward the $1,400 support zone, which served as a critical pivot point in previous bull runs.
Official Responses and Expert Consensus
Market analysts remain divided on the implications of the RSI data. On one hand, figures like @CryptoPatel have highlighted the chart patterns as a "potential golden triangle," suggesting that the current weakness is merely the final shakeout before a move toward $10,000 in the 2026-2027 window.
On the other hand, traditional financial analysts caution against relying solely on historical indicators. "Markets change," noted one lead researcher at a prominent digital asset firm. "While the RSI is at an all-time low, we are also operating in a high-inflation, high-interest-rate environment that did not exist during the 2020 or 2022 cycles. We cannot simply assume that the correlation of the past dictates the future."
The "official" response from the broader crypto community, as observed on social media and industry forums, is one of cautious accumulation. Many long-term holders view the current price levels as a "generational buying opportunity," mirroring the sentiment of those who purchased ETH when it was trading in double digits or low triple digits.
Implications: What Lies Ahead?
The implications of this historic RSI reset are profound. If the theory holds that deep RSI resets are a hallmark of cycle bottoms, then the current price of $1,612 may be remembered as the point of maximum pessimism—the exact moment before the market turned for the better.
1. The Bull Case: The "Big Spring"
If Ethereum follows its established four-year cycle, the current extreme oversold condition is the ultimate indicator of a "buy the fear" opportunity. In this scenario, the current price represents an incredible discount, and the subsequent expansion could be more violent and prolonged than previous cycles, driven by both technological upgrades and the eventual stabilization of global interest rates.
2. The Bear Case: Structural Capitulation
Conversely, if the current RSI reading is not a cyclical reset but a sign of waning institutional interest, Ethereum could face a prolonged "sideways" period. If the ETFs continue to see net outflows and the broader economy enters a recession, the $1,600 level may offer little resistance, leading to a long-term bear market that tests the resolve of even the most dedicated investors.
3. The Institutional Pivot
The role of ETFs remains the wildcard. Should we see a sustained shift from outflows to inflows, it would likely signal that the "smart money" has identified the bottom. Investors should watch the Friday ETF data closely; a return to net positive inflows would be the first tangible sign that the bearish pressure is beginning to wane.
Conclusion
Ethereum stands at a precarious, yet potentially defining, juncture. The monthly RSI, having reached its lowest point since the asset’s birth, presents a dichotomy: it is either the herald of a catastrophic failure or the indicator of a historic bottom.
As the market grapples with this data, investors are advised to prioritize risk management. While the historical trend suggests that such extreme RSI readings have preceded massive rallies, the current macroeconomic climate necessitates a more measured approach. The next few weeks of trading will be vital. If Ethereum can consolidate around the $1,600 level and stabilize, it may well prove that this historic RSI dip was not a sign of the end, but the quiet before a monumental, multi-year surge.
For now, the world watches. The charts are screaming, the data is conflicting, and the next chapter of Ethereum’s journey is being written in real-time. Whether it leads to the $10,000 milestone or a deeper descent remains the most pressing question for the industry.