
Ethereum’s Silent Shift: Behind the On-Chain Divergence Amidst Market Apathy
The current state of the Ethereum (ETH) market is defined by a paradoxical stillness. Trading below the $1,700 threshold, the second-largest cryptocurrency by market capitalization has spent weeks in a state of aimless consolidation, leaving investors grappling with a lack of clear momentum. For the casual observer, this price action—neither a robust recovery nor a catastrophic breakdown—suggests a market in decline. However, a deeper examination of on-chain activity reveals a complex structural transition occurring beneath the surface.
While retail participation appears to be fading, analytical data from CryptoOnchain suggests that Ethereum is not suffering from a loss of relevance, but rather a significant, calculated shift in its holder base. By analyzing the interplay between transaction volumes, exchange netflows, and stablecoin positioning, we can gain a clearer picture of why the current market structure may be more resilient than the price action alone implies.
The Core Phenomenon: A Tale of Two Transaction Profiles
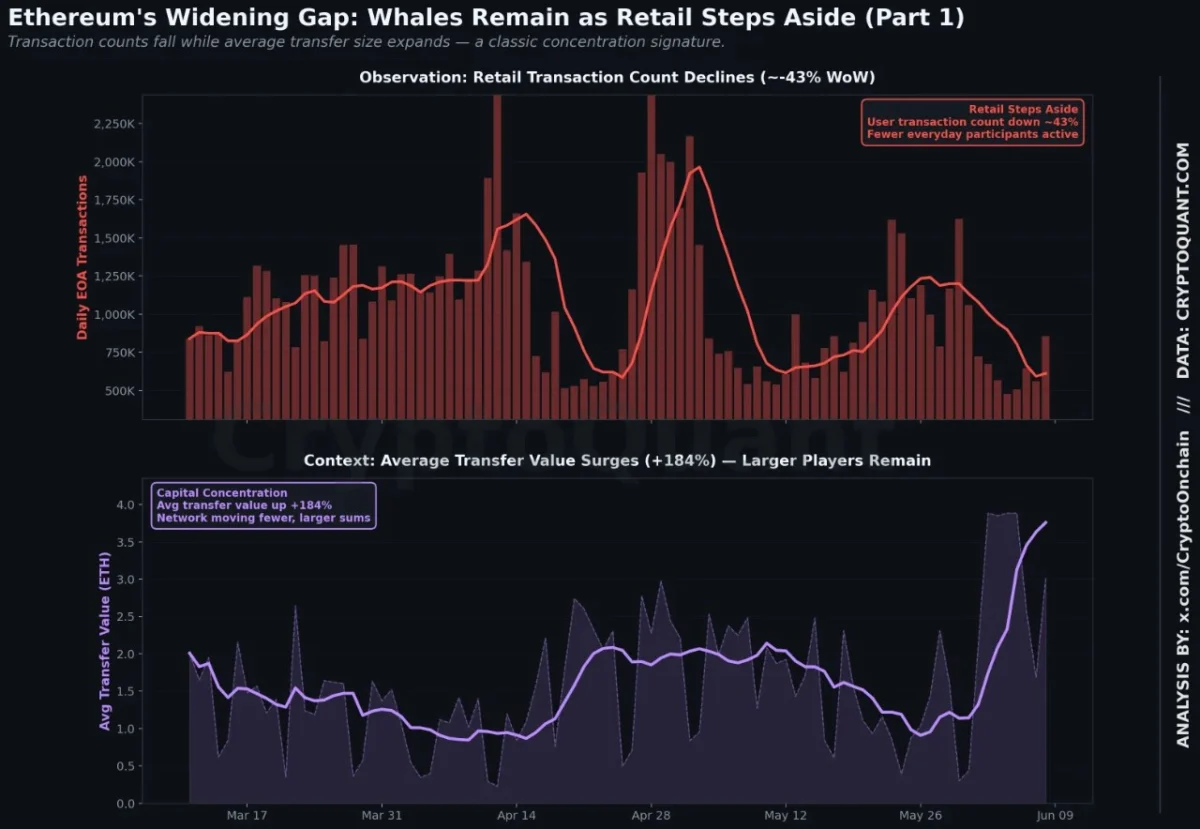
The narrative that Ethereum is losing its structural integrity is largely driven by a superficial reading of daily transaction counts. Over the past week, data indicates that daily transactions from standard user wallets have plummeted by approximately 43%. In a vacuum, such a metric is typically interpreted as a warning sign—a signal that the network is losing its utility and that user engagement is evaporating.
However, when this data is cross-referenced with the average value per transaction, the story changes entirely. While the frequency of transactions has dropped, the financial weight of those transactions has surged by over 184%. This is a textbook signal of "whale-led" activity.

Historically, this divergence serves as a definitive marker of a market undergoing consolidation. Smaller, retail-oriented participants are stepping back, likely deterred by the lack of volatility and the prevailing uncertainty. Meanwhile, larger entities—institutional players and high-net-worth individuals—are continuing to operate with high conviction. They are consolidating their positions, moving larger sums of capital in fewer, more deliberate transactions. This suggests that the "apathy" observed in the market is not a sign of total disinterest, but rather a transition of ownership from short-term retail hands to long-term institutional stakeholders.
Chronology of the 2026 Downtrend
To understand the gravity of the current situation, it is essential to view Ethereum’s performance within the context of the last six months.
- Early 2026: Ethereum entered the year with optimism, hovering within a consolidation zone between $1,800 and $1,900. This range acted as a vital demand floor, providing the foundation for potential growth throughout the first quarter.
- April – May 2026: The market attempted a recovery, peaking near the $2,400 level. However, this rally ultimately failed to sustain momentum, forming a lower high that signaled a shift in market psychology from "buy the dip" to "sell the strength."
- Late May – Early June 2026: The collapse of the $1,800–$1,900 support zone served as a pivotal technical failure. Once this floor gave way, the market experienced a sharp acceleration in selling pressure, dragging ETH to fresh 2026 lows near the $1,500 mark.
- Present Day: Ethereum is currently engaged in a battle to defend the $1,500–$1,550 support zone. This area is widely considered the most critical psychological and technical barrier for the remainder of the year.
Supporting Data: Examining the Liquidity Squeeze
The behavioral patterns identified by CryptoOnchain are supported by three distinct data pillars that suggest a tightening of the available supply.
1. The Exchange Exodus (Netflows)
Total ETH netflows remain firmly in negative territory, currently sitting at approximately -79,080 ETH. This indicates that despite the price weakness, large volumes of Ethereum are being withdrawn from centralized exchanges. When tokens are moved from exchanges to cold storage or decentralized finance (DeFi) protocols, they are removed from the "active float," significantly reducing the sell-side pressure that could otherwise drag the price lower.

2. Stablecoin Influx
While ETH is leaving exchanges, the opposite is occurring with stablecoins. Binance has seen a +$34.4 million net inflow of stablecoins, representing a 440% increase compared to the 30-day average. This indicates that while participants are hesitant to purchase ETH at the current moment, they are "parking" their buying power on exchanges. This accumulation of dry powder is a prerequisite for a reversal; when the market provides a catalyst, this liquidity is primed to re-enter the ecosystem.
3. Open Interest Expansion
Derivatives data further supports the institutional accumulation theory. Open Interest on Binance has expanded by roughly 9% over the current quarter. Combined with the movement of spot ETH, this suggests that larger players are building out their exposure across both spot and derivatives markets, positioning themselves for a future move in either direction.
Official and Expert Implications
While no central authority manages Ethereum, the consensus among industry analysts is that the current setup is a "coiled spring" scenario. Market experts emphasize that the divergence between transaction counts and transaction values is a structural indicator of maturity.
"The market is moving from a retail-led, speculative phase into a more institutional, value-based phase," notes one lead analyst at CryptoQuant. "When you see the average transaction size rising as daily counts fall, it indicates that the network is becoming a settlement layer for high-value capital rather than a playground for micro-transactions."

The implication is clear: the market is currently in a "pre-condition" phase. This means that while the structural setup for a recovery is present, it is not a guarantee. Market participants are waiting for a fundamental catalyst—whether it be a shift in macroeconomic policy, a breakthrough in Ethereum’s Layer-2 scaling solutions, or a sudden change in regulatory sentiment—to trigger the next wave of price action.
Technical Outlook: The Path Forward
Technically, the path for Ethereum is fraught with challenges. The recent sell-off, characterized by high-volume spikes, confirms that the bearish trend remains in control. The price remains suppressed well below the 50-day, 100-day, and 200-day moving averages, which serve as heavy overhead resistance.
For bulls to regain control, a two-step process is required. First, the $1,500–$1,550 support must hold firm. A failure here would open the door to a deeper retracement toward 2025 lows. Second, the price must reclaim the $1,800 level. Without reclaiming this former support, any rallies are likely to be classified as "dead cat bounces"—corrective movements within a broader, long-term downtrend.
Summary of Market Implications
The current state of Ethereum is not one of decay, but of transition. The reduction in retail activity, while visually discouraging, has cleared the noise from the market, allowing larger institutional entities to consolidate their holdings.

The combination of negative exchange netflows (supply contraction) and increased stablecoin inflows (potential demand accumulation) creates a market structure that is uniquely sensitive to new information. If sentiment shifts, the reduced "float" of Ethereum on exchanges could lead to rapid price appreciation. However, until that catalyst arrives, the market will likely remain in its current state of apathy, with participants waiting to see if the $1,500 floor can truly hold against the tide of macroeconomic uncertainty.
As the industry continues to monitor these on-chain metrics, the focus will remain on whether this consolidation phase marks the bottoming process or merely a pause before a further decline. For now, the "whales" have signaled their presence, and the rest of the market must wait to see if their conviction is validated by the price action of the coming months.