
Ethereum’s Great Disconnect: Why Network Utility is Surging While Price Remains Under Pressure
In the volatile landscape of the digital asset market, Ethereum (ETH) currently finds itself at a peculiar crossroads. While the asset’s price action remains mired in bearish sentiment—with market analysts warning of potential retests of support levels as low as $1,500—the underlying blockchain tells a starkly different story. Far from the stagnation suggested by its current valuation, the Ethereum network is currently experiencing unprecedented levels of user engagement and institutional demand.
This phenomenon, often described as a "decoupling" between price and utility, poses a compelling question for investors: Is Ethereum currently in a state of terminal decline, or is it undergoing a fundamental transformation that is being obscured by short-term market noise?
Main Facts: The Divergence Between Valuation and Usage
The central paradox facing Ethereum today is the contrast between its market price and its network health. While ETH has struggled to maintain stability, oscillating around the $1,600 support zone, its "on-chain" metrics are firing on all cylinders.
Data points from the current 2025–2026 cycle reveal that the Ethereum blockchain is processing significantly more activity than during the euphoric peaks of the 2021 bull market. This activity is not merely speculative trading volume; it is a manifestation of Ethereum’s role as the primary settlement layer for the global decentralized economy. From decentralized finance (DeFi) protocols and institutional tokenization projects to the burgeoning sector of blockchain-based applications, the network is facilitating a level of throughput that has never been seen in its history.
Chronology: From 2018 to the Current 2026 Cycle
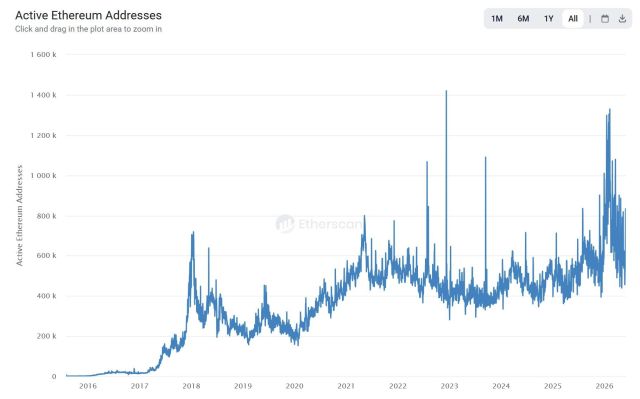
To understand the magnitude of this growth, one must look at the historical trajectory of Ethereum’s user base. The evolution of "Daily Active Addresses" serves as a definitive metric for the network’s adoption curve:

- 2018 Expansion: During the late 2017/early 2018 market cycle, Ethereum saw a peak of approximately 720,000 active wallet addresses per day. This period was characterized by the initial boom of Initial Coin Offerings (ICOs), which pushed the network to its early limits.
- 2021 Bull Market: As decentralized finance exploded, the number of active addresses climbed, hitting a ceiling of roughly 800,000 daily active wallets. At the time, this was considered a "new normal" for a maturing network.
- 2025–2026 Resurgence: In the current cycle, we have witnessed a definitive break from these historical ceilings. Daily active addresses have consistently pushed past the 1 million threshold, with peak activity exceeding 1.3 million active addresses.
This historical chronology demonstrates that while price action is cyclical and prone to extreme sentiment shifts, the underlying adoption of the Ethereum protocol has been linear and compounding.
Supporting Data: The Institutional Flight from Exchanges
Perhaps the most compelling evidence that long-term investors remain undeterred by the current price suppression is the behavior of supply on centralized exchanges.
Leon Waidmann, Head of Research at Lisk, has highlighted a critical trend: a massive, sustained withdrawal of ETH from exchange wallets. As of recent data, the total balance of ETH held on major cryptocurrency exchanges has plummeted to approximately 14.5 million—the lowest level in the network’s history.
To put this into perspective, in October 2023, there were roughly 21 million ETH sitting on exchanges. The fact that over 6 million ETH have been removed from these platforms over the last 30 months suggests a shift in holder behavior. In traditional market cycles, high volatility often triggers "panic selling," leading to massive inflows into exchanges as investors seek liquidity or exit strategies. Instead, the current trend shows that "whoever is buying here isn’t selling back." This indicates that the current supply is being absorbed by long-term holders and smart contracts, effectively creating a "supply shock" that could amplify future price movements if demand continues to rise.
Official Responses and Expert Analysis
The market is currently being scrutinized by several high-profile analysts who provide varying perspectives on the future of ETH.

The "Delta Price" Perspective
Ali Charts, a seasoned market strategist, has applied the "Delta Price" metric to identify where the current floor might reside. The Delta Price is a unique tool that calculates the difference between the average price at which assets were acquired (investor cost basis) and the average production cost for miners. Historically, this metric has been highly accurate in pinpointing deep accumulation zones. According to his analysis, should the current bearish pressure persist, the Ethereum price could potentially retest the $700 level before finding a definitive, long-term bottom.
The Network Activity Thesis
Contrasting the technical price analysis, researchers like Leon Waidmann emphasize that the "value" of a network is not solely its price, but its utility. By highlighting the all-time high in active addresses, experts argue that the market is currently ignoring the fundamental "productive" growth of the Ethereum ecosystem. When a network is used by over 1.3 million people daily, it establishes a "moat" that is difficult for competitors to bridge, regardless of short-term price fluctuations.
Implications: What This Means for the Future
The current state of Ethereum has significant implications for both retail and institutional participants.
1. The Institutionalization of DeFi
The rise in network activity, despite the price slump, suggests that institutional players are continuing to build and deploy capital on the Ethereum mainnet. The shift away from exchange-held ETH suggests that this capital is being locked into staking, yield-bearing protocols, and tokenized real-world assets (RWAs).
2. The Supply/Demand Imbalance
The withdrawal of 6 million ETH from exchanges creates a significant supply vacuum. When the macro-economic environment shifts and liquidity begins to return to the crypto markets, the combination of high network utility and low exchange-available supply could lead to a rapid price correction to the upside.
3. The Test of Resilience
For the retail investor, the current climate serves as a litmus test. The divergence between the "price is dead" narrative and the "network is at an all-time high" reality provides a clear lesson: market prices are often a lagging indicator of technological adoption. If the network continues to scale and support more users, the price is historically likely to eventually reflect that utility.
Conclusion
Ethereum is currently in a state of "structural expansion" while simultaneously suffering from "price contraction." While technical analysts correctly point to the risks of further downside—with the potential for a $700 retest serving as a stark warning—the fundamental data paints a picture of a robust, growing, and increasingly scarce asset.
The current market cycle is testing the conviction of Ethereum holders. However, for those looking beyond the ticker, the metrics indicate that the network is healthier than ever before. Whether the price hits $700 or surges toward new highs, the transition of Ethereum into a global, institutional-grade settlement layer appears to be well underway, with or without the immediate approval of the current market price. As the ecosystem continues to evolve, the disconnect between utility and valuation may eventually close, potentially setting the stage for a period of significant growth for the world’s most active blockchain.