Bitcoin Under Pressure: Miner Stress, Technical Support, and the Battle for the $60,000 Threshold
Main Facts
The cryptocurrency market has once again found itself at a critical psychological and financial crossroads. Bitcoin (BTC), hovering in the low-$60,000 range, has reignited intense debate among on-chain analysts, macro economists, and technical traders. At the core of the discussion is a sobering metric: Bitcoin is trading near—or potentially below—its estimated average cost of production.
This development has brought the concept of "miner stress" back to the forefront of industry discourse. When the market price of Bitcoin dips below the operational expenses required to mint new coins, mining enterprises face a severe squeeze on profit margins. Historically, analysts view this phenomenon through a dual lens. While it signals acute short-term pain for infrastructure providers, past market cycles suggest that prolonged periods of miner capitulation frequently coincide with the late, foundational stages of a bear market rather than the violent onset of a secular downtrend.
Simultaneously, technical analysis paints a picture of a market fiercely defending a crucial macro demand zone. Trading within the $60,000 to $62,000 range, Bitcoin has triggered reactions from key liquidity pools. Analysts tracking the asset on platforms like TradingView point out that a recent sweep of weak lows indicates a cleansing of over-leveraged long positions. However, whether this region acts as a launching pad for a major market reversal or merely a temporary speed bump before a deeper correction remains the central question facing investors.
The unfolding market dynamic is shaped by several core elements:
- Production Cost Dynamics: BTC prices testing or falling beneath average operational cost thresholds for miners.
- The Miner Capitulation Thesis: Examining whether current structural stress points to a market bottom or extended weakness.
- Technical Support Zones: The significance of the $60,000–$62,000 liquidity band in absorbing sell-side pressure.
- Market Confirmation Requirements: The technical prerequisites necessary for bulls to reassert control, moving beyond passive support defense.
Chronology of Events
To understand how the market arrived at this delicate juncture, it is essential to trace the sequence of events and analytical observations that have dominated the crypto sphere through mid-2026.
The Correction and Structural Shift
The journey toward the current $60,000 baseline began following a sharp rejection from previous local highs. As broader macroeconomic headwinds and shifting liquidity trends put pressure on risk assets, Bitcoin experienced a steady descent. During this corrective phase, leveraged long positions accumulated in previous weeks were systematically liquidated, draining speculative froth from derivatives markets.
The On-Chain Warning: June 20, 2026
On June 20, prominent crypto commentator shabr.eth published an analytical post on X (formerly Twitter) that brought production costs back into the spotlight. Highlighting data models tracking the economic realities of proof-of-work validation, the post pointed out that Bitcoin was once again trading below its average cost of production. The commentary emphasized a vital historical nuance: while this metric underscores immense immediate pressure on network operators, prior market cycles show that such conditions typically manifest during the closing chapters of bear markets, serving as a precursor to macro consolidation rather than the catalyst for a systemic collapse.
Technical Convergence at Key Support
As the on-chain debate heated up, technical analysts turned their attention to price action. A widely shared TradingView analysis authored by Smart_money_Fx mapped out the BTC/USD pair reaching a major structural support zone. According to the analysis, the market’s plunge into the low-$60,000 bracket successfully swept a pool of weak lows, liquidating trailing stop-losses. This aggressive sweep cleared the path for price stabilization, with spot and derivative buyers stepping in to defend the multi-month demand zone between $60,000 and $62,000.
Supporting Data and On-Chain Metrics
Evaluating whether Bitcoin is genuinely trading below production costs requires a nuanced understanding of how mining economics are calculated. Production costs are not a single, static figure; they fluctuate dynamically based on a variety of shifting factors.
[Network Hashrate] + [Electricity Tariffs] + [ASIC Hardware Efficiency]
       = Estimated Average Cost of Production (~$60,000 Baseline)
Variables in Production Cost Models
- Network Hashrate and Difficulty: As total computational power dedicated to securing the Bitcoin network fluctuates, mining difficulty adjusts automatically. Higher hashrate increases competition, requiring more electrical power and hardware capability to mine a single Bitcoin.
- Electricity Tariffs: Energy costs represent the single largest operational expenditure for commercial mining operations. Seasonal shifts, geopolitical energy disruptions, and regional utility rates cause wide variances in individual miner break-even points.
- Hardware Efficiency: The transition from older-generation Application-Specific Integrated Circuits (ASICs) to modern, highly energy-efficient rigs creates a stark divide in operational costs. Well-capitalized institutional miners running cutting-edge hardware boast significantly lower break-even thresholds than smaller, legacy operations.
When aggregated models suggest the average global cost of production sits near or slightly above current spot prices, it implies that a substantial portion of the mining ecosystem is operating at a net loss.

Historical Precedents of Miner Stress
Market historians look back at prior cycles—such as the late-2018 flush, the March 2020 COVID-19 liquidity crash, and the mid-2022 bear market lows—to contextualize current miner stress. During these periods, distressed miners frequently exhibited distinct behavioral patterns:
- Treasury Liquidation: Miners forced to sell accumulated Bitcoin reserves onto the open market to cover fixed overhead costs (facility leases, debt servicing, and electricity bills), adding localized downward selling pressure.
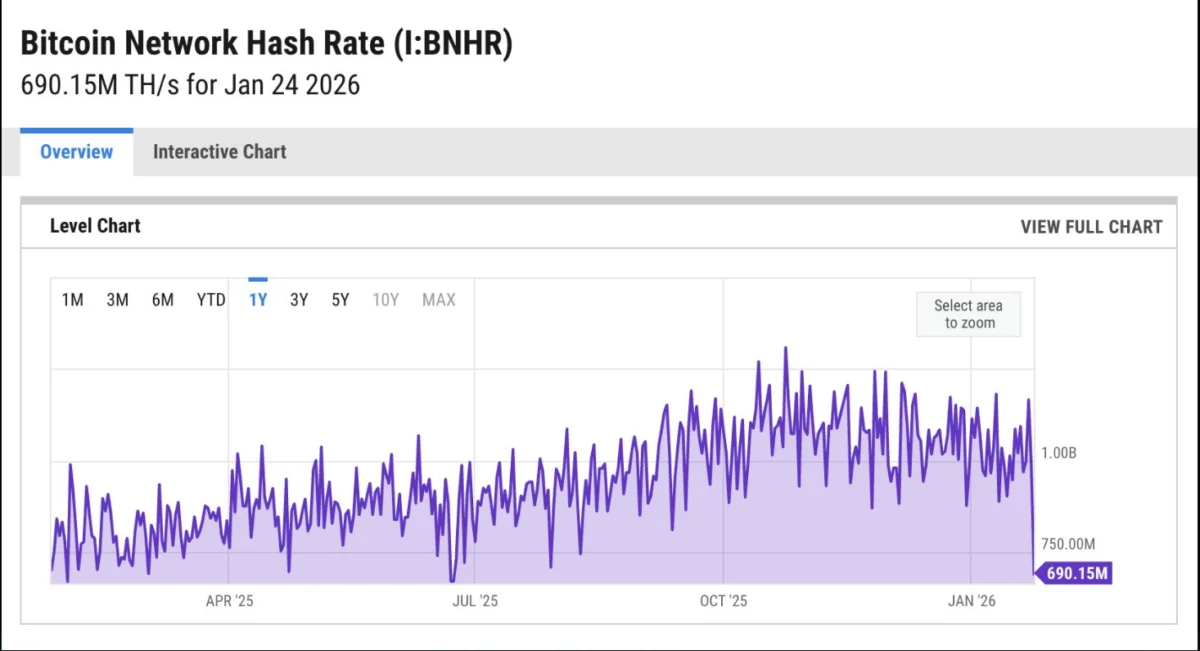
- Hashrate Outflows: Unprofitable operations temporarily or permanently shutting down older rigs, leading to noticeable dips in total network hashrate before difficulty adjustments recalibrate equilibrium.
- Capitulation as a Macro Bottom: Paradoxically, the peak of miner capitulation has historically signaled maximum market pessimism, frequently aligning closely with macro cyclical bottoms where smart money accumulates assets from distressed sellers.
Industry Perspectives and Analyst Responses
The convergence of miner stress indicators and critical technical support has divided market commentators, sparking robust debate across digital asset communities.
The Bearish Caution: Structural Vulnerability
Conservative market analysts warn against viewing production-cost thresholds as an automatic "buy signal." Market commentators emphasize that while low prices inflict pain on miners, there is no absolute economic law preventing an asset from trading below its production cost for extended periods. If macroeconomic conditions deteriorate further or if institutional demand falters, distressed miners could trigger a cascade of forced selling. In this scenario, the liquidation of miner treasuries could accelerate downward momentum, pushing prices deep into lower support brackets.
The Bullish Reversal Thesis: Liquidity Sweeps and Demand Absorption
Conversely, technical proponents view the interaction with the $60,000–$62,000 zone through an optimistic lens. Analysts like Smart_money_Fx argue that the swift rejection of lower prices demonstrates robust underlying demand. By sweeping the liquidity resting below previous local lows, the market successfully purged weak hands. Proponents of this view argue that as long as this structural demand area holds, the downside risk is largely asymmetric, favoring a powerful relief rally or a structural trend reversal once sell-side exhaustion is complete.
Macroeconomic and Market Implications
The interplay between production costs, technical support, and miner health carries profound implications for the broader cryptocurrency landscape and its participants.
Impact on Mining Infrastructure and Centralization
Sustained periods below production costs accelerate consolidation within the Bitcoin mining sector. Smaller, independent operators lacking access to cheap energy contracts or venture capital financing are often forced out of business or into acquisition talks with larger, publicly traded mining giants. While this process improves the overall efficiency and security resilience of the remaining network over the long term, it raises ongoing questions regarding geographical and corporate hashrate centralization.
Derivatives and Leverage De-risking
For derivatives traders, the current environment serves as a stark reminder of market fragility. The purging of weak longs around the $60,000 threshold reduces immediate open interest, cooling an overheated futures market. However, until Bitcoin demonstrates a convincing break above local overhead resistance, market participants remain vulnerable to sudden volatility spikes driven by algorithmic trading and macroeconomic data releases.
What to Watch: Confirming Market Strength
Market observers agree that holding support is merely the first step in constructing a durable bullish narrative. For confirmation that the current phase represents a cyclical bottom rather than a consolidation pause before further downside, market watchers are looking for specific technical developments:
- Reclamation of Local Resistance: BTC must break and close above short-term moving averages and established resistance bands to invalidate the recent bearish market structure.
- Volume-Backed Momentum: Price expansion must be supported by genuine spot accumulation rather than short-covering rallies in the derivatives market.
- Hashrate Stabilization: Evidence that network hashrate is stabilizing or recovering, indicating that miner capitulation has peaked and operational balance has been restored.
Until these confirmatory signals emerge, the intersection of miner stress and technical support remains a critical battleground—a zone where underlying market pain is either systematically absorbed by long-term capital or translated into the next leg of a broader macro correction.