Ethereum’s Great Paradox: Record Network Utility Amidst Bearish Price Action
The digital asset landscape is currently witnessing a fascinating divergence in the Ethereum ecosystem. While price charts depict a struggling asset flirting with critical support levels, the underlying blockchain infrastructure is operating at an intensity never before seen in its history. This disconnect between market valuation and network utilization has become a focal point for institutional investors and decentralized finance (DeFi) analysts alike.
As Ethereum faces mounting bearish pressure, with eyes fixed on the $1,500 support threshold, the narrative of "price as the only metric of health" is being challenged. Data from across the industry suggests that while the dollar-denominated price of ETH may be in a cooling phase, the network itself is thriving, processing more activity than at the height of previous bull market cycles.
Main Facts: A Tale of Two Realities
The current state of Ethereum can be summarized by a stark contrast: stagnant price action versus explosive network utility.
Technically, Ethereum has struggled to maintain its footing above $1,600. Market analysts are increasingly concerned that if this support fails, a retracement toward the $1,500 mark—or potentially deeper into the $700 zone—could be on the horizon. This downward momentum is largely attributed to broader macroeconomic factors, including interest rate uncertainty and shifting investor sentiment toward risk-on assets.

However, beneath the surface of these red candles, the "on-chain" reality tells a different story. Ethereum is effectively serving as the backbone of modern decentralized finance, institutional tokenization, and global smart contract deployment. The network is not just surviving the current bearish cycle; it is experiencing a renaissance of engagement. Daily active addresses, transaction throughput, and the withdrawal of supply from centralized exchanges all point toward a "hidden" bull market happening behind the curtain of price action.
Chronology: From 2018 to the Present Day
To understand the magnitude of current activity, one must look at the historical trajectory of Ethereum’s adoption.
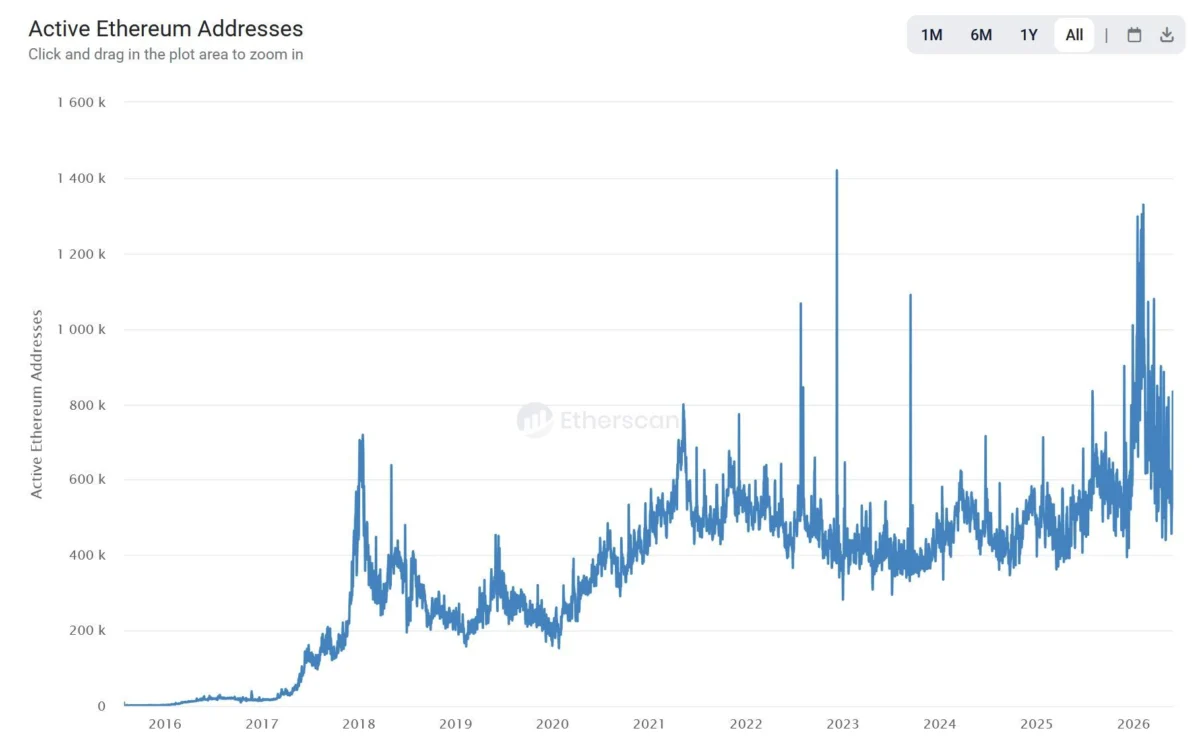
- The 2018 Cycle: During the peak of the 2018 market cycle, Ethereum’s network activity was considered revolutionary, yet it hit a ceiling of roughly 720,000 active wallet addresses per day.
- The 2021 Bull Run: As the DeFi summer and NFT boom propelled the 2021 market to record highs, the network matured significantly, with daily active addresses topping out at 800,000.
- The 2025–2026 Shift: In the current cycle, we have witnessed a paradigm shift. Daily active addresses have consistently surged past the 1 million mark, with several peaks exceeding 1.3 million.
This data indicates that the network is currently processing substantially more real-world activity than it did during the euphoria of 2021. This sustained increase in address activity suggests that Ethereum has moved beyond speculative trading and into a phase of functional, long-term utility.
Supporting Data: The "Illiquidity" Signal
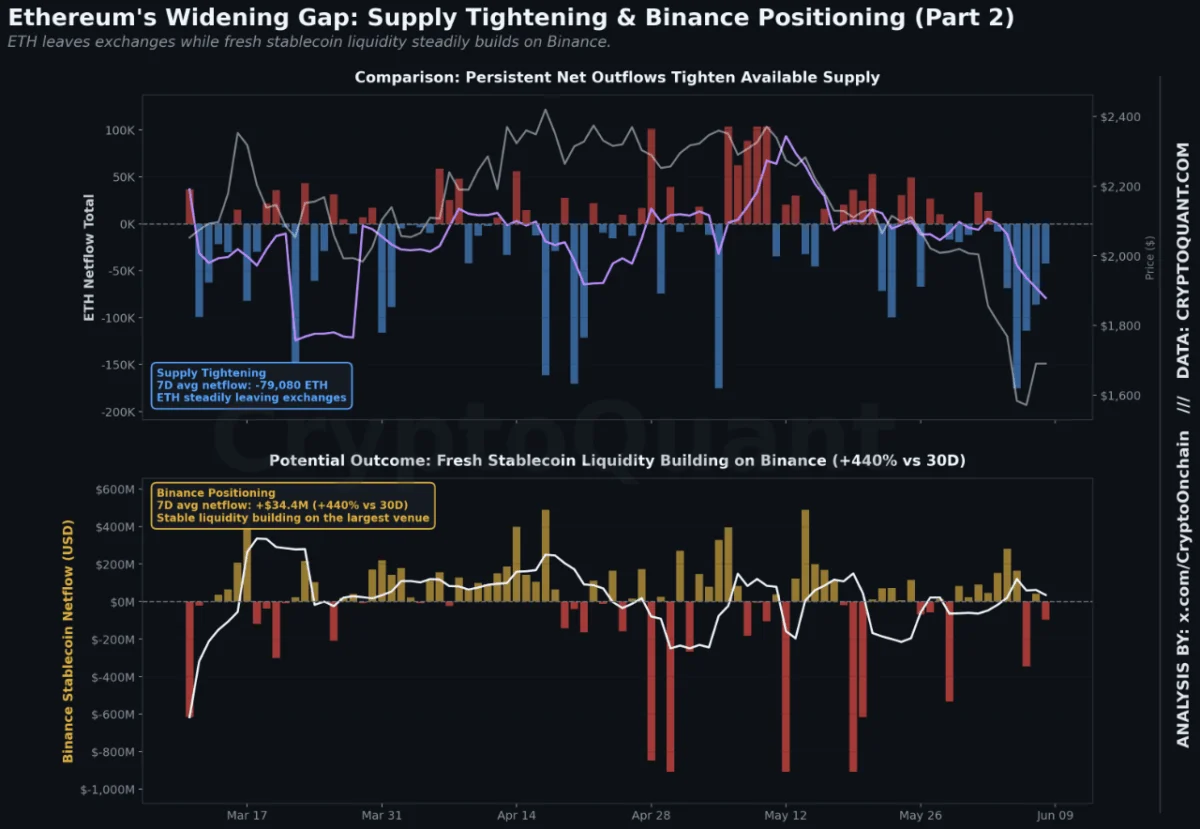
One of the most compelling arguments for Ethereum’s structural health is the rapid decline of ETH held on centralized exchanges. According to research from Leon Waidmann, Head of Research at Lisk, the total volume of ETH held on major exchanges has plummeted to approximately 14.5 million—the lowest level in history.

The Exchange Exodus
Since October 2023, when exchange balances hovered around 21 million ETH, over 6 million ETH have been withdrawn into private custody or locked into staking and DeFi protocols. In previous market cycles, heightened volatility almost always resulted in massive inflows to exchanges as traders prepared to dump their holdings.
The current trend is the exact opposite. This indicates a high level of "conviction holding." As Waidmann succinctly put it: "Whoever is buying here isn’t selling back." This massive supply shock, coupled with increased network utility, creates a unique supply-demand dynamic that could trigger a significant repricing once the bearish macro-headwinds subside.
The Delta Price Metric
Adding to the analytical depth, crypto analyst Ali Charts has utilized the "Ethereum Delta Price" to map potential bottoms. The Delta Price, which measures the difference between the average price paid by investors (market cap) and the realized cost basis of the network, has historically been a reliable indicator of "deep value" zones. Based on this metric, the model suggests that a bottom near $700 could represent the final capitulation phase before a sustained, long-term reversal.
Official Perspectives and Expert Analysis
The consensus among market researchers is that Ethereum’s role as the primary settlement layer for the internet of value is no longer in question. Experts highlight three primary drivers of this sustained growth:
- Institutional Tokenization: Large-scale financial institutions are increasingly using Ethereum as the ledger for real-world assets (RWAs).
- Decentralized Banking: The growth of L2 (Layer 2) scaling solutions has lowered the barrier to entry, allowing for more frequent, smaller transactions that aggregate into massive network load.
- The "Staking" Effect: The shift to Proof-of-Stake has turned ETH into a yield-bearing asset, encouraging long-term holding rather than short-term trading.
While bearish sentiment dominates the headlines, research firms like Lisk argue that we are witnessing a "structural decoupling." The network is growing in its ability to support value, regardless of the temporary market fluctuations caused by speculative traders.
Implications: What Lies Ahead?
The implications for investors are twofold. On the one hand, the technical charts warn of short-term pain. The potential for a retest of the $700 level is a reality that sophisticated traders are currently hedging against. The volatility inherent in the current macro environment suggests that the "bottom" may not be a single day, but a zone of accumulation that could persist for several months.
On the other hand, the long-term outlook is fundamentally bullish. When a network experiences its highest levels of adoption and lowest levels of exchange-held supply simultaneously, it creates a "coiled spring" effect.
Future Considerations:
- Regulatory Clarity: As Ethereum continues to be used for institutional tokenization, clearer regulatory frameworks will likely follow, further legitimizing its role in the global financial system.
- Network Throughput: As Layer 2 solutions become more efficient, the cost of using Ethereum will drop further, likely pushing active address counts even higher.
- The Price-Value Gap: Eventually, the market price must reconcile with the network’s utility. If the current trend of increasing active addresses and decreasing exchange supply continues, the eventual price discovery phase could be significantly more aggressive than what has been seen in previous cycles.
In conclusion, Ethereum is currently traversing a difficult path. While the price action reflects the anxieties of a global market under pressure, the blockchain’s performance remains robust and historically unprecedented. For investors, the takeaway is clear: the underlying infrastructure is stronger than ever, suggesting that the current market phase is a test of conviction rather than a sign of structural failure. Whether the bottom is $1,500 or $700, the data suggests that Ethereum is not just surviving—it is quietly building the foundation for the next iteration of the global financial system.