
The Great Compression: Why Ethereum’s Profitability Profile Has Stalled in the Current Cycle
In the volatile landscape of digital assets, Ethereum (ETH) has long been considered the bellwether for decentralized finance and smart contract utility. However, recent data from leading on-chain analytics firm Glassnode suggests that the network is experiencing a structural shift that has left many investors questioning the asset’s current growth trajectory. A detailed analysis of Ethereum’s supply-side profitability reveals that the current market cycle has failed to reach the benchmarks of success seen in previous bull runs, pointing toward a significant "compression" in profit profiles that could have lasting implications for the market.
Main Facts: The 300% Profit Threshold
The core of the recent concern stems from a metric tracking the share of Ethereum’s circulating supply currently held at a gain of 300% or more. Historically, this indicator serves as a barometer for the strength of a bull market; as more investors see their holdings triple in value, the network typically experiences high levels of activity and capital inflows.
According to Glassnode’s latest findings, only 11% of the total Ethereum supply is currently sitting at a 3x profit relative to the cost basis of the original acquisition. This figure represents a dramatic cooling compared to previous cycles. In the 2019 and 2022 bear markets—periods often characterized by extreme pessimism—the network actually maintained higher levels of profitability than what we are witnessing today. To find a comparable level of suppressed profitability, one must look back as far as February 2017, a time when Ethereum was still in its relative infancy.
Perhaps most concerning to institutional analysts is the failure of the current cycle to break the 30% threshold for this metric. In the two prior cycles, the share of supply in 3x profit consistently surged past 50% during the peak of the bullish phase. The inability to even approach this milestone indicates that the "wealth effect" usually associated with an Ethereum bull run has been significantly muted.

Chronological Context: From Euphoria to Stagnation
To understand the gravity of this data, it is necessary to examine the timeline of Ethereum’s market maturity.
The 2017-2018 Cycle: This era was defined by the Initial Coin Offering (ICO) boom. During this period, the surge in ETH price was parabolic. A large portion of the circulating supply was acquired at extremely low cost bases, leading to massive unrealized gains for early adopters. The 300% profit threshold was not just met; it was obliterated as the asset reached then-all-time highs.
The 2020-2021 Cycle: Driven by the advent of Decentralized Finance (DeFi) and the rise of Non-Fungible Tokens (NFTs), this period saw a second major wave of capital. Despite the volatility, Ethereum’s price action was consistent enough to push the majority of long-term holders into significant profit, with the 50% supply-in-profit benchmark being breached with relative ease.
The 2023-2025 Period: The current cycle has been marked by macroeconomic headwinds, including high interest rates and regulatory uncertainty. While Ethereum transitioned to a Proof-of-Stake consensus mechanism—a fundamental shift intended to reduce supply through burning mechanisms—the anticipated price appreciation has not mirrored the intensity of previous years. Instead, the profitability profile has narrowed. Investors who entered the market during the 2021 peak remain largely underwater, and new capital has been hesitant to drive the asset to the levels of sustained growth required to push the majority of the supply back into the "3x profit" zone.

Supporting Data: The MVRV Ratio and Short-Term Pain
Beyond the long-term supply metrics, the current pain is being felt acutely by short-term market participants. Data from Santiment, another premier on-chain analytics firm, highlights the "30-day MVRV (Market Value to Realized Value) Ratio," which measures the profitability of traders who have entered the market within the last month.
The 30-day MVRV Ratio serves as an indicator of whether an asset is overbought or oversold. When the ratio drops into negative territory, it signals that recent buyers are collectively sitting on unrealized losses. Following a recent market-wide crash, this ratio plummeted for both Bitcoin and Ethereum.
As of the latest reporting, the 30-day MVRV for Ethereum sits at approximately -12%, while Bitcoin hovers around -10%. This negative reading is a classic indicator of capitulation. When average traders are underwater, "weak hands"—those who lack the conviction or financial runway to wait out a dip—typically exit their positions. While this creates short-term selling pressure, historically, this phase of "washout" is often a prerequisite for a market bottom, as it allows long-term, high-conviction investors to accumulate at discounted levels.
Official Perspectives and Industry Interpretation
Industry experts have weighed in on the "compression" narrative. Glassnode’s analysts noted in their commentary that Ethereum’s profitability profile has "fundamentally compressed," suggesting that the market dynamic has changed permanently. This could be attributed to several factors:

- Increased Market Maturity: As Ethereum has become a larger asset class, the volatility required to generate 300% returns has increased, making such milestones harder to achieve.
- Staking Dynamics: With a significant portion of ETH locked in staking contracts, the liquid supply available for trading has changed behavior.
- Capital Rotation: Investors are now spread thin across an ecosystem that includes Layer-2 solutions, Solana, and other competing L1 networks, diluting the singular focus on Ethereum that defined previous cycles.
Santiment analysts offer a more optimistic view of the current capitulation. They argue that when the average trader is sitting on significant losses in a market that usually hovers near a zero-sum equilibrium, the selling pressure often reaches an exhaustion point. Once this exhaustion is reached, the market is usually primed for a reversal, as the only participants left are those with a longer time horizon.
Implications for the Future
What does this mean for the average investor? The compression of profitability suggests that the days of "easy" massive gains in Ethereum may be giving way to a more nuanced, institutional-grade market environment.
1. The End of "Easy Alpha": Investors should temper expectations regarding the speed of future bull runs. The market is increasingly driven by fundamental utility (L2 transaction volume, staking yields) rather than speculative fervor.
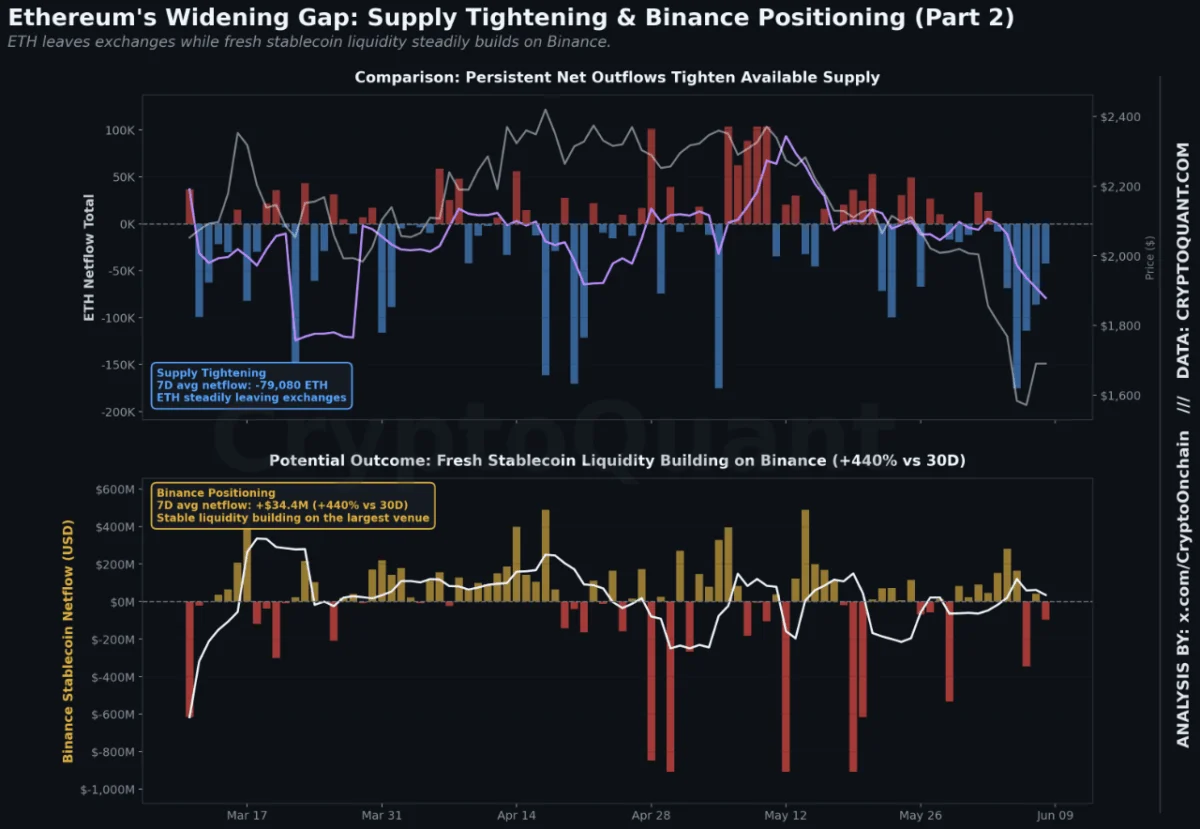
2. The Capitulation Window: The negative MVRV ratios suggest that we are in a period of "pain management." While the price has bounced from its lows—recovering from the $1,500 range to approximately $1,680—the path to recovery requires the absorption of the remaining supply held by disillusioned short-term holders.
3. Accumulation Patterns: The current data suggests that the market is currently in a transition phase. For those looking at Ethereum as a long-term asset, the compression of profitability is not necessarily a sign of failure, but rather a sign that the asset is undergoing a "reset."
In conclusion, while the lack of profitability in the current cycle is objectively lower than in previous years, it provides a clearer picture of the current market’s limitations. Ethereum is no longer the speculative, high-beta asset it once was; it is a maturing infrastructure layer. The compression of its profitability profile is the growing pain of a network transitioning from speculative hype to institutional utility. Whether this leads to a new era of stable growth or a prolonged period of stagnation remains the central question for the remainder of the year. For now, the focus remains on whether the current support levels near $1,600 can hold as the market works through the residual selling pressure of recent months.