Ethereum’s Silent Shift: Behind the On-Chain Divergence Amidst Market Apathy
Ethereum is currently navigating a period of profound stagnation, trading below the $1,700 mark as a palpable sense of apathy and uncertainty blankets the cryptocurrency markets. For traders and investors, the current environment is one of extreme frustration; the asset lacks the momentum for a decisive recovery, yet it has not triggered a capitulatory collapse.
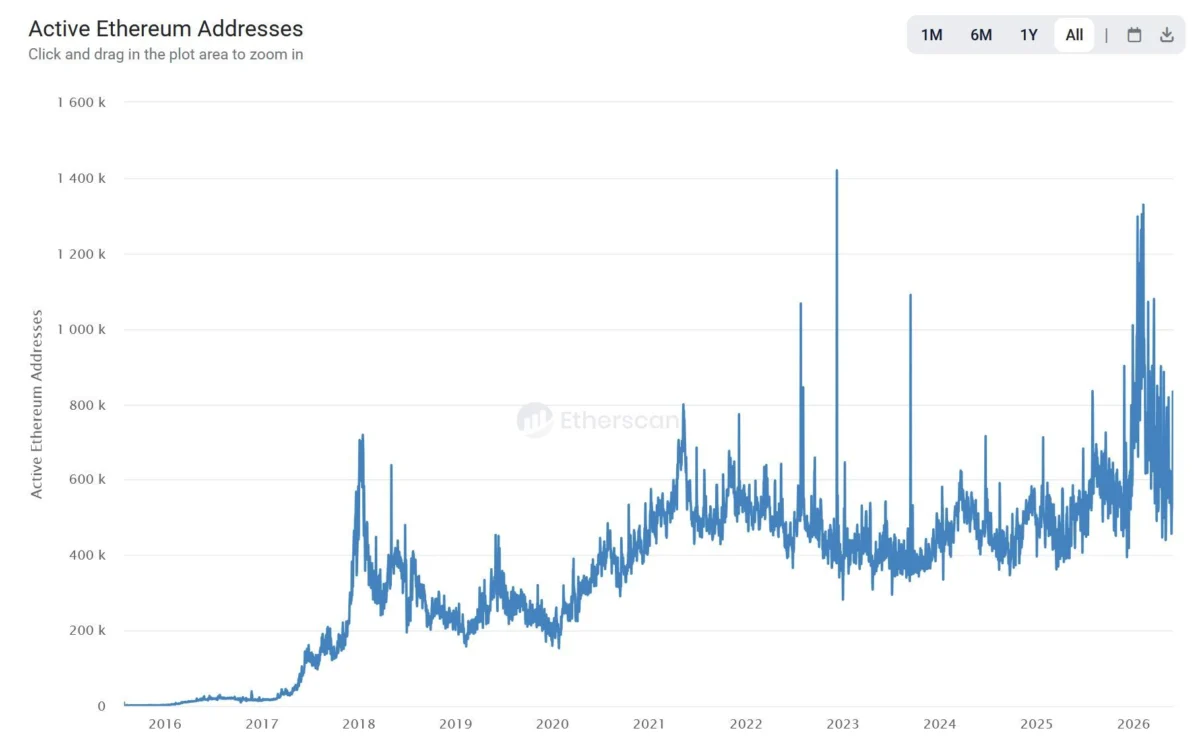
However, beneath the surface of this directionless price action, granular on-chain data provided by CryptoOnchain suggests a transformation in market composition. While the casual observer might interpret Ethereum’s current weakness as a sign of structural decay, the underlying network metrics tell a more nuanced story of consolidation, whale accumulation, and a tightening of the available supply.
Main Facts: The Great Retail Exit
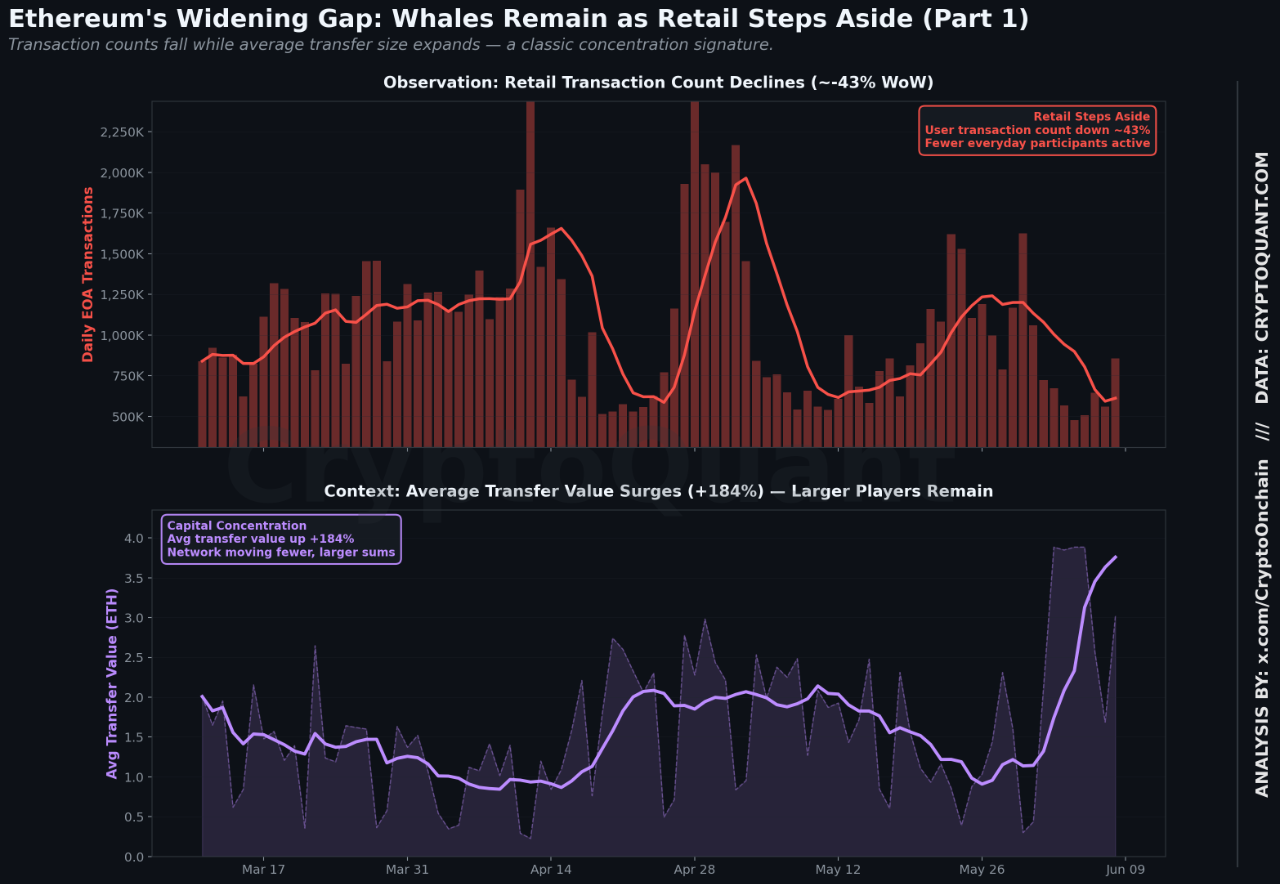
The most striking development in recent weeks is a sharp, 43% decline in daily transactions initiated by regular retail wallets. In a vacuum, such a drop is typically viewed as a bearish signal, indicating that the network is losing relevance and that users are fleeing the ecosystem during a period of market stress.
Yet, this narrative of abandonment fails to account for the inverse correlation observed in transaction value. While the frequency of transactions has plummeted, the average value of the remaining transfers has surged by over 184%. This is not a network in decline; it is a network transitioning. The "small-fry" participants—retail traders and casual users—are stepping to the sidelines, waiting for clearer market signals. Simultaneously, institutional players and "whales" are doubling down, moving massive amounts of capital in fewer, higher-value transactions. This indicates that the decline in transaction counts is a byproduct of retail exhaustion, not a lack of utility or institutional interest.

Chronology: From $2,400 to the Current Consolidation
To understand the current impasse, one must look at the recent historical trajectory of Ethereum.
- The February-May Consolidation: Ethereum spent the first half of the year building a support base between $1,800 and $1,900. During this period, the market appeared stable, and investors felt confident in the asset’s ability to hold its ground.
- The Breakdown (June 2026): The technical floor at $1,800 failed to hold under sustained selling pressure. This breach acted as a catalyst, triggering a rapid liquidation cascade that pushed Ethereum to fresh 2026 lows near $1,500.
- The Post-Crash Phase: Since the collapse, Ethereum has struggled to regain its footing. The market has been characterized by a sequence of lower highs and lower lows, placing the asset firmly in a bearish structural trend.
- Current State: As of mid-June 2026, Ethereum is fighting to maintain the $1,500–$1,550 support zone. The market is currently in a "wait-and-see" phase, where participants are assessing whether this level can serve as a durable floor for a mid-term recovery.
Supporting Data: The Whale and Stablecoin Nexus
The divergence between retail apathy and institutional activity is supported by significant flow data from major exchanges, most notably Binance.
1. The Supply Squeeze
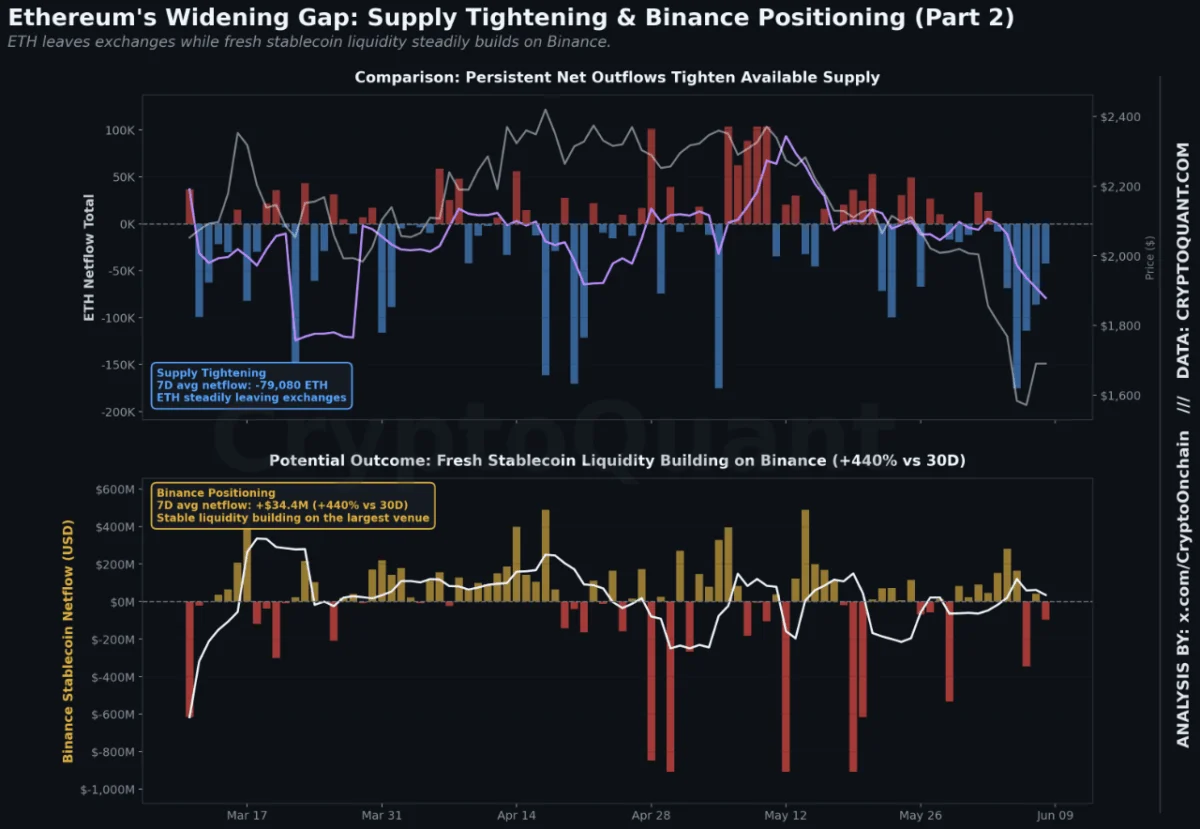
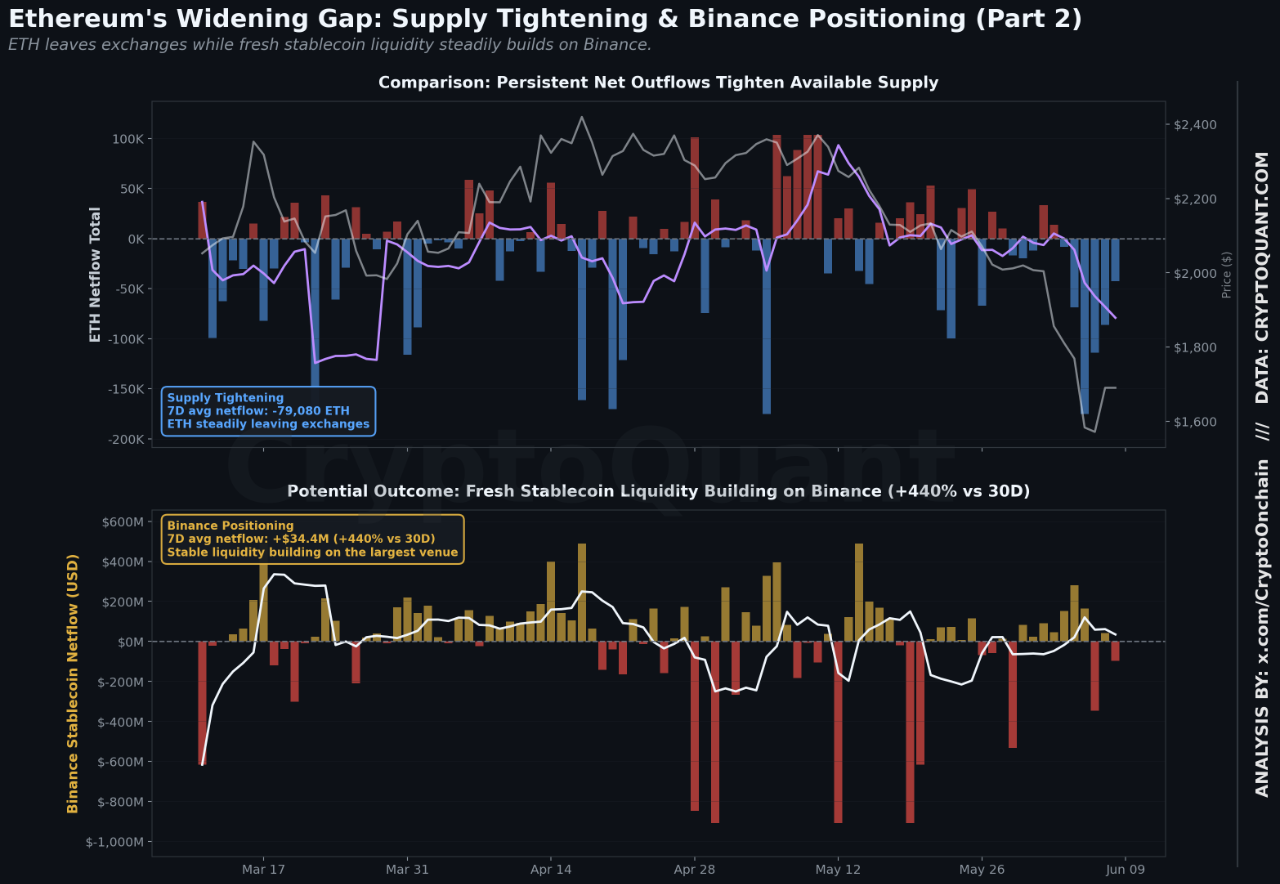
Total ETH netflows remain deeply negative, hovering at approximately -79,080 ETH. This indicates a consistent, large-scale movement of Ethereum off centralized exchanges and into cold storage or private wallets. When large volumes leave exchanges, they are no longer immediately available for sale, effectively tightening the "float" (the supply available for trading).
2. The Stablecoin Inflow
While spot ETH is leaving exchanges, "dry powder" is arriving. Stablecoin netflows into Binance have surged by 440% compared to the 30-day average, totaling roughly $34.4 million. This indicates that major participants are parking capital in liquid, USD-pegged assets, positioning themselves to acquire ETH should the price reach an attractive entry point or show signs of reversal.

3. Derivatives Exposure
Open Interest on Binance has expanded by 9% over the current quarter. When coupled with the stablecoin inflows, it becomes clear that sophisticated market participants are building leveraged positions. They are not merely holding; they are actively preparing for volatility, signaling a conviction that the current price levels represent a significant opportunity.
Technical Analysis: The Battle for $1,500
From a technical perspective, Ethereum’s chart remains under bearish control. The asset is trading well below its 50-, 100-, and 200-day moving averages, which serves as a sobering reminder of the long-term trend.
The recent sell-off that broke the $1,800 support level was accompanied by a massive spike in trading volume, confirming that the move was backed by significant selling conviction. While a brief bounce occurred near the $1,500 mark, the inability of bulls to reclaim the $1,800 resistance suggests that the market is still searching for a bottom. Analysts note that until Ethereum can reclaim the $1,800 zone, any rallies should be treated as corrective "dead cat bounces" rather than the initiation of a new bull market.
Implications: A Catalyst-Driven Future
What does this mean for the average investor? The current market structure is a classic "pre-move" setup. We have a tightening supply of ETH on exchanges, high-conviction players consolidating their positions, and a massive influx of stablecoin liquidity waiting on the sidelines.
However, it is crucial to remain objective: this structure does not guarantee a price increase. Market setups of this nature are essentially "coiled springs." They require a catalyst—such as a shift in macroeconomic policy, an unexpected network upgrade, or a significant change in regulatory sentiment—to trigger a move.
The implication of the current data is that when that catalyst arrives, the move may be more violent than expected. Because retail participation has thinned out, there is less "noise" in the order books. When the large entities currently holding stablecoins decide to deploy their capital, the resulting price action could be amplified due to the reduced supply of ETH currently available for purchase on exchanges.
Conclusion: Preparing for the Shift
The narrative of Ethereum being in a state of "structural decline" is a surface-level reading that ignores the deeper accumulation patterns occurring on-chain. While the technical indicators remain bearish and the price struggles to find a floor, the underlying behavior of large holders suggests that the "smart money" is not exiting; they are consolidating.
For the disciplined investor, this period of apathy is not a time for panic but for observation. The divergence between transaction frequency and transaction value, coupled with the ongoing supply contraction, points to a market that is preparing for a significant transition. Whether that transition results in a deeper test of the $1,500 support or a breakout toward the $1,800 resistance remains to be seen. In the interim, the market remains a game of patience, where those who understand the mechanics of the current consolidation will be best positioned for the eventual return of volatility.
As we look ahead, the interplay between the massive stablecoin inflows and the ongoing withdrawal of spot ETH from exchanges will likely be the primary barometer for Ethereum’s next major move. Investors are advised to watch the $1,500 support closely; a failure here could invite further downside, while a hold could set the stage for the next phase of institutional accumulation.