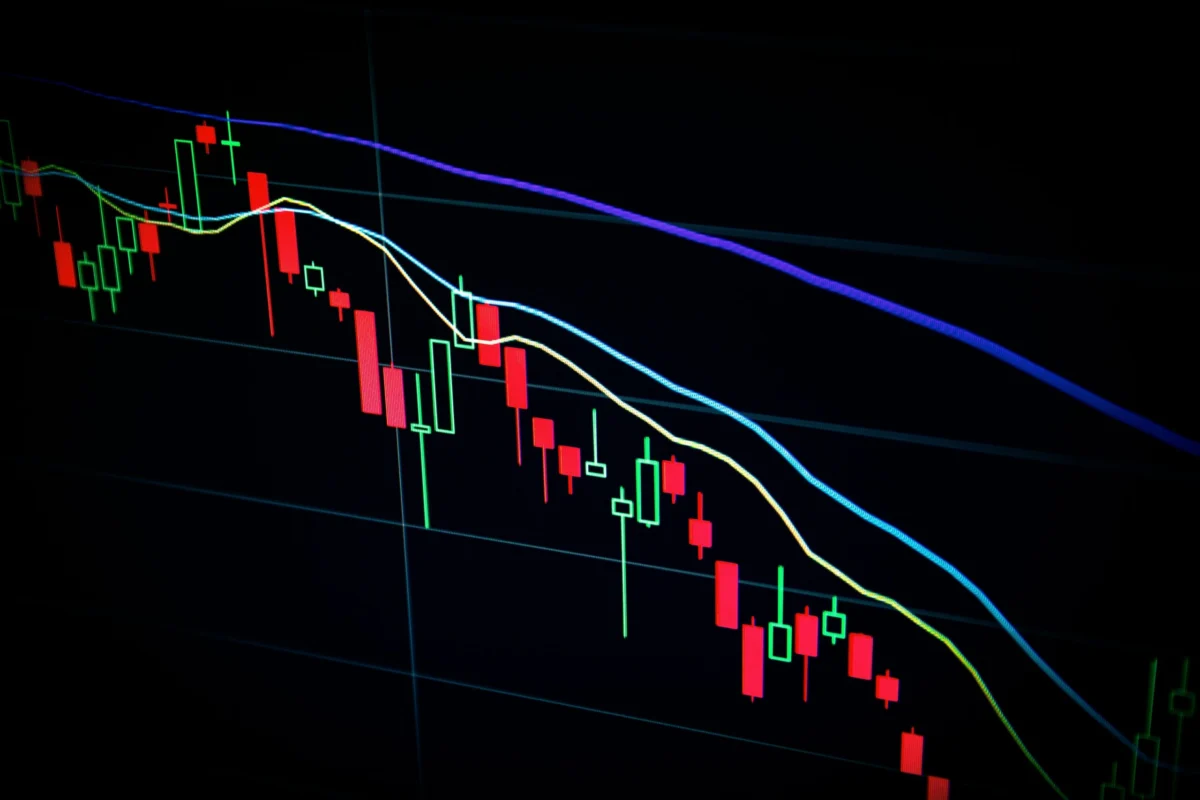
Bitcoin’s $59,000 Threshold: Analyzing the Mechanics of a Market Rebound Amid Supply Pressure
Bitcoin is currently navigating a critical juncture, testing the $59,000 price level as market participants seek a sustainable rebound. While the headline figure may appear straightforward, the underlying mechanics driving this price action are complex, shaped by a convergence of government wallet activity, shifting ETF flows, and a fragile global risk appetite. To understand where Bitcoin is headed, one must move beyond the surface-level volatility and examine the structural shifts within the digital asset ecosystem.
Main Facts: The Current Market Landscape
At the time of writing, Bitcoin is oscillating near the $59,000 mark. This specific price point serves as a psychological and technical battleground for traders who have spent the better part of the summer navigating a series of supply-side shocks. The current "rebound attempt" is not merely a product of speculative fervor; it is a fundamental test of market depth.
The market is currently grappling with several distinct variables:
- Supply Overhang: Recent activity from government-linked wallets has created a "supply pressure" narrative that continues to weigh on investor sentiment.
- Institutional Participation: Bitcoin Exchange-Traded Funds (ETFs) remain the primary vehicle for institutional capital, yet their flows have become erratic, reflecting broader macroeconomic uncertainty.
- The $59k–$60k Resistance: This zone has emerged as the natural pivot point. A clean breakout above this range would suggest that buyers have effectively absorbed the recent influx of supply, while a rejection could signal a return to lower support levels.
Chronology: The Road to $59,000
The current price action is the culmination of a volatile Q3. Understanding how we arrived at this $59,000 test requires a look back at the events that shaped the current liquidity environment.
Phase 1: The Liquidity Squeeze (Late Q2 to Early Q3)
The market began to show signs of fatigue as the anticipated "post-halving" rally failed to materialize with the expected velocity. During this period, large-scale movements from government-controlled addresses—often tied to the liquidation of seized assets—sparked fears of a supply glut. These movements, tracked transparently via platforms like Arkham Intelligence, provided the market with real-time data on potential selling pressure.
Phase 2: The ETF Calibration
Throughout the summer, institutional interest via ETFs faced a reality check. While initially seen as a "guaranteed" driver of price, ETF flows began to correlate more tightly with traditional equity market risk-off events. This period saw a transition from aggressive accumulation to a more cautious, data-dependent approach by institutional allocators.
Phase 3: The Current Consolidation
Over the past two weeks, Bitcoin has been carving out a base. The recent push toward $59,000 represents the first major attempt by the bulls to reclaim the momentum lost during the mid-summer corrections. Traders are now watching to see if the volume accompanying this move is sufficient to break through the overhead resistance established during the previous sell-off.
Supporting Data: The Mechanics of Market Depth
Data is the only antidote to speculation in the cryptocurrency markets. By utilizing on-chain analytics, market participants can better understand the "why" behind the "what."
The Role of Entity Tracking
Platforms such as Arkham Intelligence provide the necessary transparency to track "entity-labeled" wallets. When government wallets or known institutional custodians shift assets, the market reacts instantly. However, the lesson of the current cycle is that raw on-chain data is not a prophecy. A wallet transfer does not necessarily equate to an exchange deposit, and an exchange deposit does not necessarily equate to an immediate sale.
Liquidity and Derivatives
Market depth is currently being tested by derivatives positioning. High open interest in Bitcoin futures near the $59,000-$60,000 range suggests that a significant amount of leverage is at play. Traders should monitor the funding rates on major exchanges; if funding rates remain neutral despite the price push, it suggests a "healthy" spot-driven move. Conversely, if funding rates spike, it indicates an over-leveraged long bias, which is historically a precursor to a "long squeeze."
Official Responses and Expert Consensus
While the decentralized nature of Bitcoin means there is no "CEO" to issue statements, the institutional response to the current market state has been characterized by a shift in narrative. Major financial analysts and desk heads have largely pivoted from "buy the dip" rhetoric to "manage the volatility."
Market analysts emphasize that the $59,000 level is a reflection of the "cost basis" for many institutional investors who entered the market during the first half of the year. The lack of selling at this level suggests that long-term holders are becoming increasingly indifferent to short-term price fluctuations, a phenomenon often referred to as "HODLer maturity."
Furthermore, regulatory commentary from global financial watchdogs has remained relatively muted, which in the current environment is viewed as a positive. The absence of negative regulatory "surprises" allows the market to focus on liquidity dynamics rather than legal risk.
Implications: What Comes Next?
For investors and traders, the path forward is contingent upon how the market handles the $59,000-$60,000 resistance zone.
The Bullish Scenario
If Bitcoin can consolidate above $60,000 with increased spot volume, the narrative shifts toward a re-test of the cycle highs. A clean absorption of the current supply overhang would signal that the "weak hands" have been flushed out, leaving the market in a stronger position for the final quarter of the year.
The Bearish Scenario
Failure to hold the $59,000 level—or a rejection at $60,000 followed by a breakdown—would likely force a re-test of the $55,000 support. In this scenario, the market would require a new catalyst to reignite interest, likely linked to macroeconomic developments, such as shifts in central bank interest rate policies or further easing of global inflation metrics.
A Disciplined Approach
The most critical takeaway for market participants is to avoid treating isolated headlines as defining events. The market is currently in a "show me" phase. A single green candle is not a trend; a series of higher lows backed by consistent exchange inflows and healthy derivatives positioning is.
Conclusion: Watching the Signal, Not the Noise
As the market continues to evolve, the distinction between "noise" and "signal" has never been more important. The $59,000 Bitcoin test is a vital piece of the puzzle, but it is only one piece. By integrating on-chain transparency, ETF flow data, and derivatives positioning, investors can form a more nuanced view of the landscape.
The current cycle is defined by a shift toward maturity. The projects and assets that maintain utility and transparency—backed by verifiable data—are the ones most likely to emerge stronger when the current period of volatility subsides. As we watch the price action unfold over the coming sessions, the key is to prioritize patience. Crypto moves with lightning speed, but the most enduring trends are those that stand the test of time, regardless of the noise surrounding the daily ticker.
Disclaimer: This article is based on information from the Arkham Intelligence platform. The content provided is for informational purposes only and does not constitute financial advice. All market participants should conduct their own research and exercise caution when navigating the volatile cryptocurrency markets.
Written by the News Desk, edited by Samuel Rae.