Ethereum Faces Crucial Juncture as Derivatives Market Shows Uneven Deleveraging
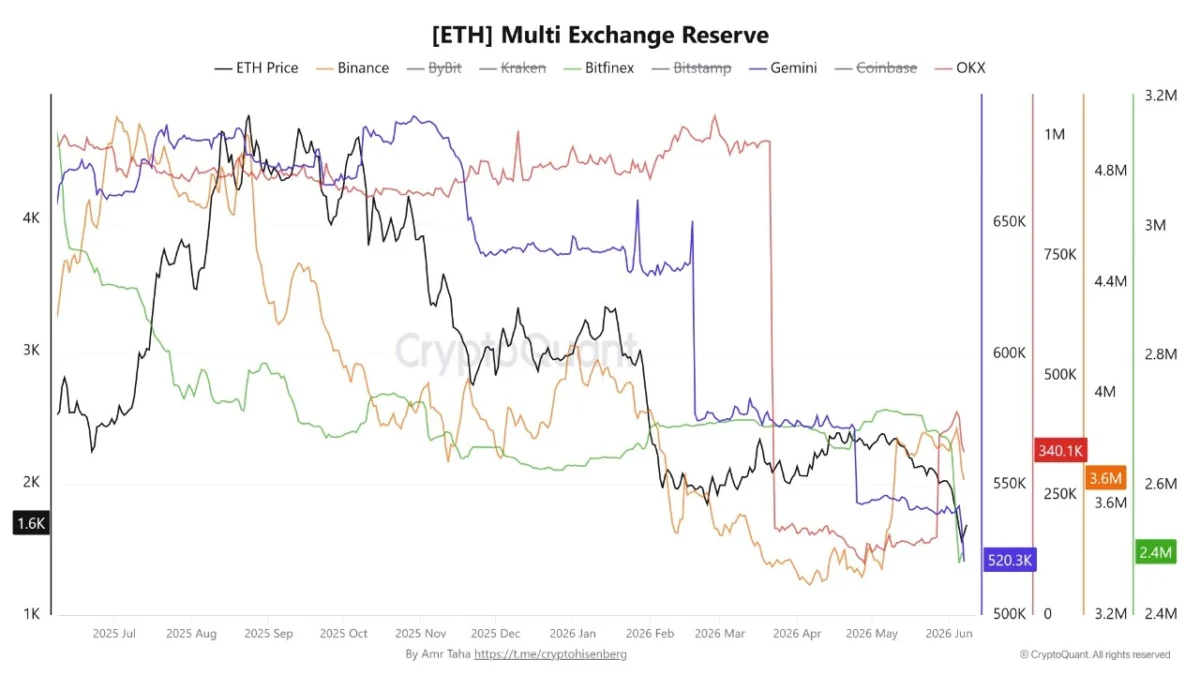
New York, NY – June 10, 2026 – Ethereum (ETH), the second-largest cryptocurrency by market capitalization, is currently navigating a critical support test below the $1,700 mark. Recent price declines, which have seen ETH shed approximately 28% from its recent highs, are being analyzed through the lens of derivatives market activity. A recent report by CryptoQuant, a leading blockchain analytics firm, highlights a significant, albeit uneven, deleveraging event across major exchanges. This development suggests that the current price weakness is rooted in a structural shift within the derivatives market that extends far beyond short-term volatility.
The core of the analysis centers on the substantial drop in Open Interest (OI) – the total number of outstanding derivative contracts, such as futures and options, that have not yet been settled. This decline, observed across prominent trading venues, indicates a significant unwinding of leveraged positions that had been accumulating throughout much of 2025 and into 2026. The scale of this unwinding has effectively reset OI levels on multiple exchanges to those last seen in April 2025, a development that erases over a year’s worth of leveraged exposure in a remarkably compressed timeframe.
The Great Deleveraging: Open Interest Resets Across Exchanges
The data paints a stark picture of this deleveraging process. On Gate.io, ETH’s Open Interest plummeted from $4.84 billion on May 7 to $2.68 billion on June 9. This represents a reduction of approximately $2.16 billion, or roughly 45%, in just over a month. Critically, the current OI reading on Gate.io closely mirrors the $2.67 billion recorded on April 11, 2025. A similar trend is evident on Bybit, where ETH Open Interest has fallen to approximately $805 million, a figure almost identical to the $795 million level observed on April 9, 2025.
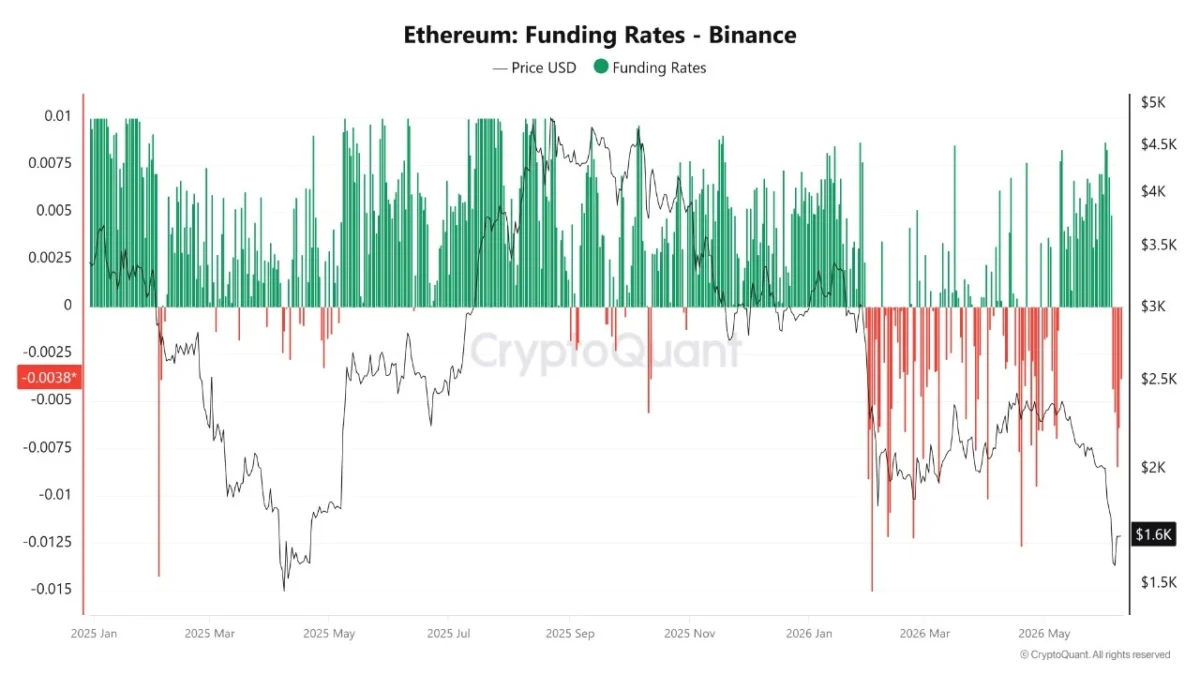
The simultaneous return of two major exchanges to their April 2025 market structure is a significant indicator. It suggests that the speculative leverage built up across the entire subsequent period has been substantially cleared. Further supporting this narrative, Binance’s funding rates have turned negative. This phenomenon, where traders holding short positions are paid by those holding long positions, signals a lack of bullish conviction in the remaining futures activity. Instead, it points towards uncertainty, or at best, a mild bearish bias among active traders.
Funding Rates: The True Indicator of Market Sentiment
While the sheer drop in Open Interest is noteworthy, CryptoQuant’s analysis identifies a crucial asymmetry between different exchanges that complicates a straightforward interpretation of a complete market reset. Gate.io and Bybit have indeed returned to April 2025 market structures, effectively clearing over a year of accumulated leverage within weeks. However, Binance has not followed the same trajectory. ETH Open Interest on Binance remains around $2.76 billion, staying close to its higher range, while other major venues have seen sharp contractions.

This retained positioning on Binance does not necessarily imply bullish intent. The funding rates provide a more nuanced and accurate reflection of sentiment. Binance’s funding rate, currently around -0.0038, has turned negative again. This indicates that traders are not willing to pay a premium to hold long exposure. While Open Interest persists, the underlying conviction has shifted from directional betting to a more defensive stance.
The combination of these factors paints a complex picture. The derivatives reset is undeniably occurring, but it is uneven. Some exchanges have purged leveraged positions entirely, while Binance retains significant positioning. This is happening against a backdrop of negative funding rates, which suggest caution rather than outright confidence. Negative funding rates during a price decline can be attributed to several conditions:
- Defensive Positioning: Traders may be hedging existing long positions by taking short futures positions to mitigate potential losses.
- Short Pressure: Traders may be actively betting against a recovery, initiating short positions in anticipation of further price declines.
- Absence of Bullish Conviction: The lack of aggressive long interest means that participants are not willing to pay a premium to hold bullish exposure, which is typical in a strong uptrend.
None of these conditions are indicative of a market poised for a significant rally. Collectively, they suggest a derivatives structure that has partially reset, with the largest exchange holding residual positions that lack the directional commitment required for constructive market movement.
Ethereum Breaks February Lows: Can Bulls Defend Critical Support?
Adding to the bearish sentiment, Ethereum has recently broken below its February lows, trading near $1,670. This marks one of the most significant weekly breakdowns of the current cycle, pushing ETH to levels not seen since early 2023. This price action is particularly consequential as it invalidates the broad trading range that had contained ETH for much of 2026 and confirms the continuation of the bearish structure that has been in development since the rejection from the $4,800 cycle peak.
From a market structure perspective, the chart of ETH/USD exhibits a clear sequence of lower highs and lower lows. Following its failure to sustain a rally above the $2,250-$2,350 resistance zone, Ethereum lost the critical $1,800 support area, which had previously served as the floor for its February-March consolidation. This breakdown triggered a rapid descent towards the $1,500 region, where buyers ultimately intervened to prevent a more severe collapse.

A key technical observation is that ETH is now trading below all major weekly moving averages. The 50-week, 100-week, and 200-week moving averages are all situated significantly above the current price. This clustering reinforces the strength of the prevailing downtrend and creates substantial overhead resistance for any potential recovery attempts.
The recent low established near $1,500 now represents the most critical support level on the chart. If buyers can successfully defend this area, Ethereum might be able to establish a base and attempt a recovery towards the $1,800 mark. However, a weekly close below these recent lows would expose the market to a deeper retracement, potentially towards the $1,300-$1,400 region. Such a scenario would further extend the current correction and confirm a significant deterioration in Ethereum’s long-term market structure.
Chronology of the Decline and Derivatives Shift
The current market conditions can be traced back to several key developments:
- Early 2025: A period of sustained bullish momentum and increasing leverage in the derivatives market, characterized by rising Open Interest across major exchanges. This period saw speculative capital flow into ETH, driving its price to significant highs.
- Late 2025 – Early 2026: The market began to show signs of weakness, with ETH failing to break above crucial resistance levels. This period saw a gradual increase in bearish sentiment, with funding rates on some exchanges beginning to fluctuate.
- April 2025 (Benchmark): Open Interest levels on exchanges like Gate.io and Bybit were around $2.67 billion and $795 million, respectively. These levels represent a significant point of reference for the current deleveraging.
- May 7, 2026: Gate.io’s ETH Open Interest stood at $4.84 billion, indicating peak leveraged exposure on that platform.
- June 9, 2026: Gate.io’s ETH Open Interest had fallen to $2.68 billion, and Bybit’s to approximately $805 million, effectively erasing over a year of accumulated leverage on these platforms.
- Early June 2026: Binance’s funding rates turned negative, signaling a shift in sentiment even as its Open Interest remained relatively elevated.
- June 9, 2026 (Current Price Action): Ethereum trades below $1,700, having broken below previous support levels and now testing critical junctures not seen since early 2023.
Supporting Data: On-Chain and Derivatives Insights
The narrative of an uneven deleveraging is further supported by several data points:
- Open Interest (OI) Reduction: As detailed, the dramatic fall in OI on Gate.io and Bybit signifies a substantial reduction in speculative bets. This is a key indicator that market participants are either exiting leveraged positions or are being forced out due to margin calls.
- Funding Rate Divergence: The negative funding rates on Binance, while OI remains relatively high, suggest a disconnect between open contracts and conviction. Traders are not willing to pay to hold longs, indicating a lack of confidence in immediate price appreciation. This contrasts with periods of bullish rallies where funding rates are typically positive, reflecting high demand for long exposure.
- Price Action: The breakdown below February lows and the failure to hold previous support levels ($1,800) are direct manifestations of selling pressure and a lack of buying interest at higher prices. The current consolidation below $1,700 indicates a market in search of a stable floor.
- Moving Averages: The fact that ETH is trading below its 50, 100, and 200-week moving averages on a weekly chart is a strong bearish signal. These averages act as significant psychological and technical resistance levels, and being below them implies a firmly established downtrend.
Implications for the Ethereum Market
The current market dynamics suggest a period of continued uncertainty for Ethereum. The uneven deleveraging in the derivatives market implies that while some speculative excess has been purged, the largest venue still holds significant positions that are not backed by strong bullish conviction. This could lead to:

- Increased Volatility: The retained positions on Binance, coupled with negative funding, could lead to sharp price swings as traders adjust their positions.
- Limited Upside Potential: Without a broad-based increase in bullish sentiment and a reduction in leveraged shorts, significant upward price momentum will likely be challenging to sustain.
- Risk of Further Declines: If the $1,500 support level fails to hold, the market could experience a cascade of further selling, driven by stop-loss orders and a broader capitulation.
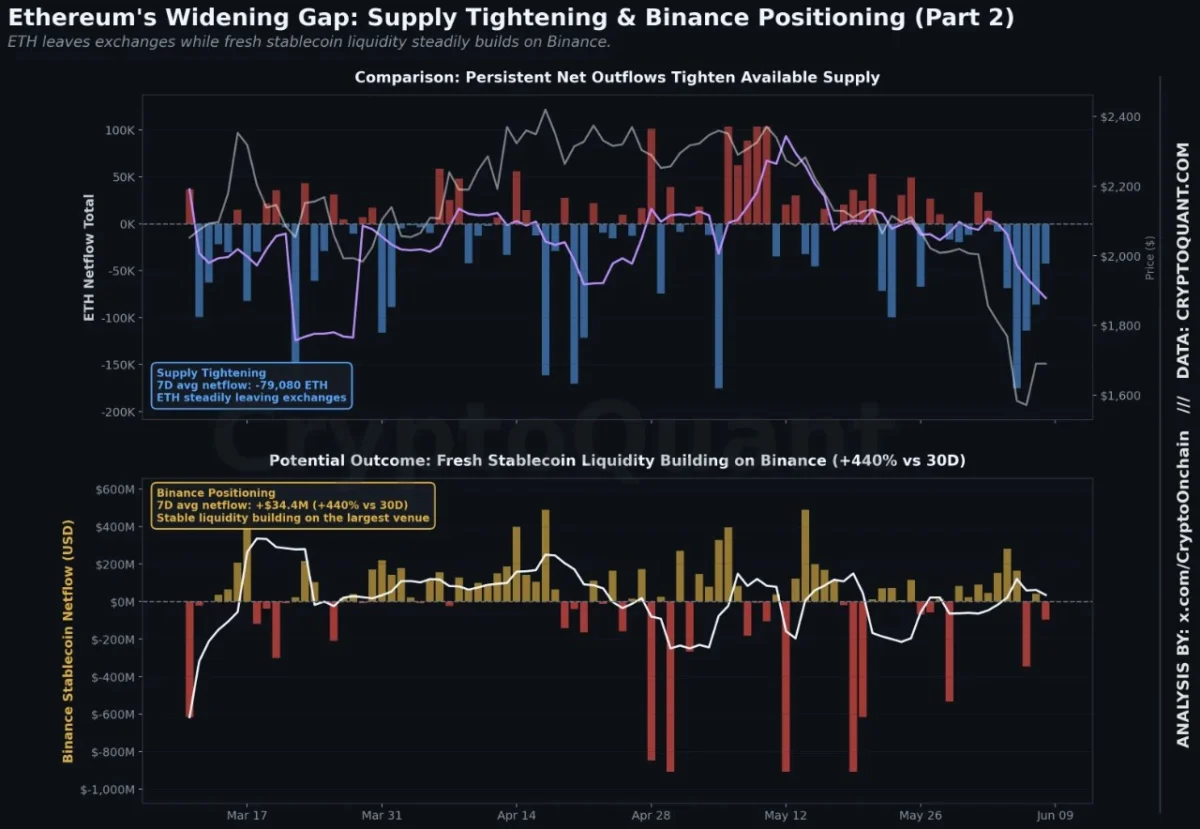
- Importance of Spot Market Demand: The focus may shift towards the strength of demand in the spot market. A sustained inflow of capital into ETH from long-term investors and institutions could provide a foundation for recovery, even if the derivatives market remains cautious.
While the precise future trajectory remains uncertain, the current analysis of Ethereum’s derivatives market points to a crucial juncture. The market is undergoing a significant structural adjustment, and the coming weeks will likely determine whether the current support levels can hold or if further price deterioration is on the horizon. Investors and traders are closely watching for signs of genuine buying conviction and a more cohesive deleveraging across all major trading platforms.
Disclaimer: This article is for informational purposes only and does not constitute financial advice. Cryptocurrency investments are volatile and involve significant risk. Readers should conduct their own research and consult with a qualified financial advisor before making any investment decisions.