Ethereum Navigates Market Apathy: On-Chain Data Hints at Strategic Accumulation Amidst Price Stagnation
London, UK – October 26, 2023 – Ethereum, the second-largest cryptocurrency by market capitalization, is currently experiencing a period of significant price stagnation, trading below the critical $1,700 mark. This protracted sideways movement has fostered an atmosphere of apathy and uncertainty within the market, frustrating traders on both sides of the spectrum. While the price is neither staging a convincing recovery nor undergoing an aggressive breakdown, on-chain data analyzed by CryptoOnchain suggests a narrative that directly contradicts the notion of a structurally declining market. Instead, emerging patterns indicate a strategic consolidation of capital by larger holders, commonly referred to as "whales," as retail investors adopt a more cautious stance.
On-Chain Divergence: Fewer Transactions, Greater Value
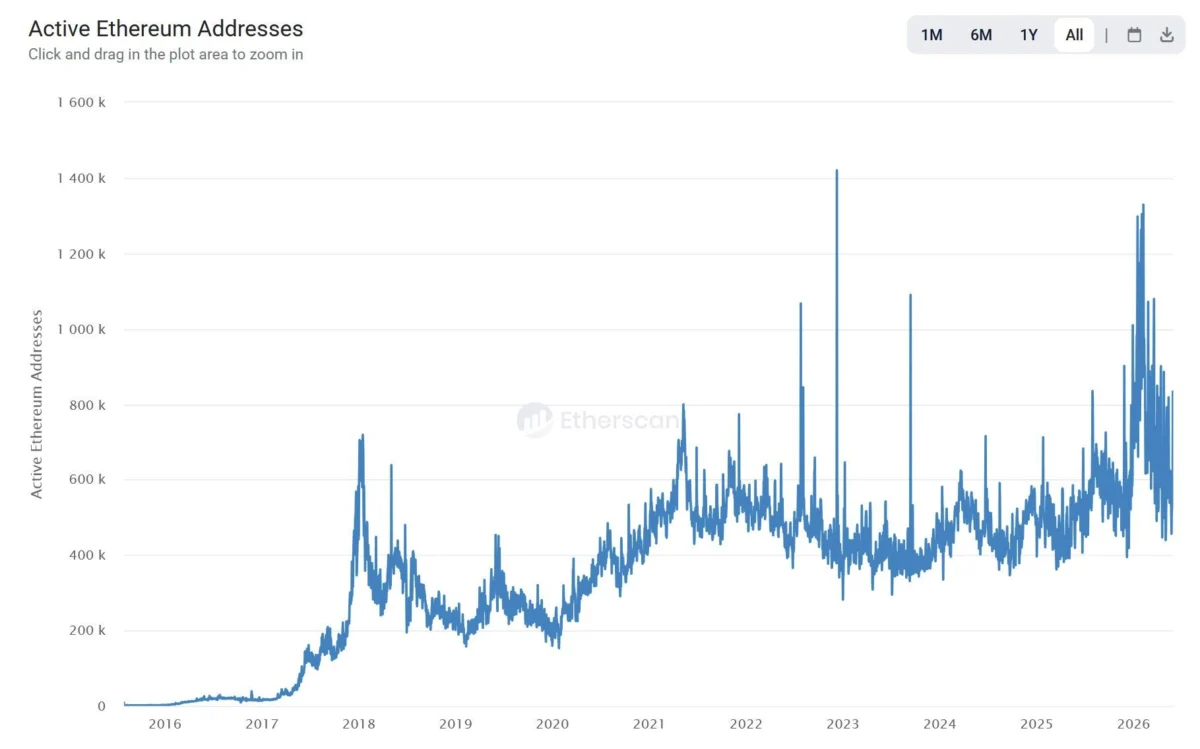
The most striking development highlighted by CryptoOnchain’s analysis lies within Ethereum’s on-chain transaction patterns over the past week. A notable divergence has emerged: daily transactions originating from regular user wallets have seen a substantial drop of approximately 43%. In isolation, this decline would typically signal a waning network engagement and relevance, particularly during a challenging market phase. However, this initial observation serves as the starting point for a deeper investigation.
Contrary to the decrease in transaction volume, the average value moved per transaction has experienced a remarkable surge of over 184%. Furthermore, the median transfer size has escalated even more dramatically. This suggests that while Ethereum is processing fewer transactions, the transactions that are being executed are significantly larger and more substantial than those observed previously.
This specific combination of declining transaction counts and surging transfer values is a well-recognized pattern in on-chain behavior, especially during periods of market stress. Historically, smaller, routine participants tend to reduce their activity, stepping aside to await greater market clarity. Meanwhile, larger holders often continue to operate, moving capital through fewer but more significant transactions. These larger movements are indicative of deliberate positioning rather than everyday network usage.
CryptoOnchain’s analysis posits that this divergence is not a harbinger of a fading network. Instead, it is a clear indicator of capital consolidating into fewer, more substantial hands at current price levels. This strategic accumulation by well-capitalized entities suggests a belief in Ethereum’s long-term value, even amidst prevailing market uncertainty.
The Setup Is Consolidating: Evidence from Flow Data
The analysis by CryptoOnchain extends beyond transaction patterns, connecting the observed divergence to broader flow data. This corroborates the same behavioral pattern from multiple independent angles, strengthening the argument for strategic consolidation.
Key Flow Data Observations:
-
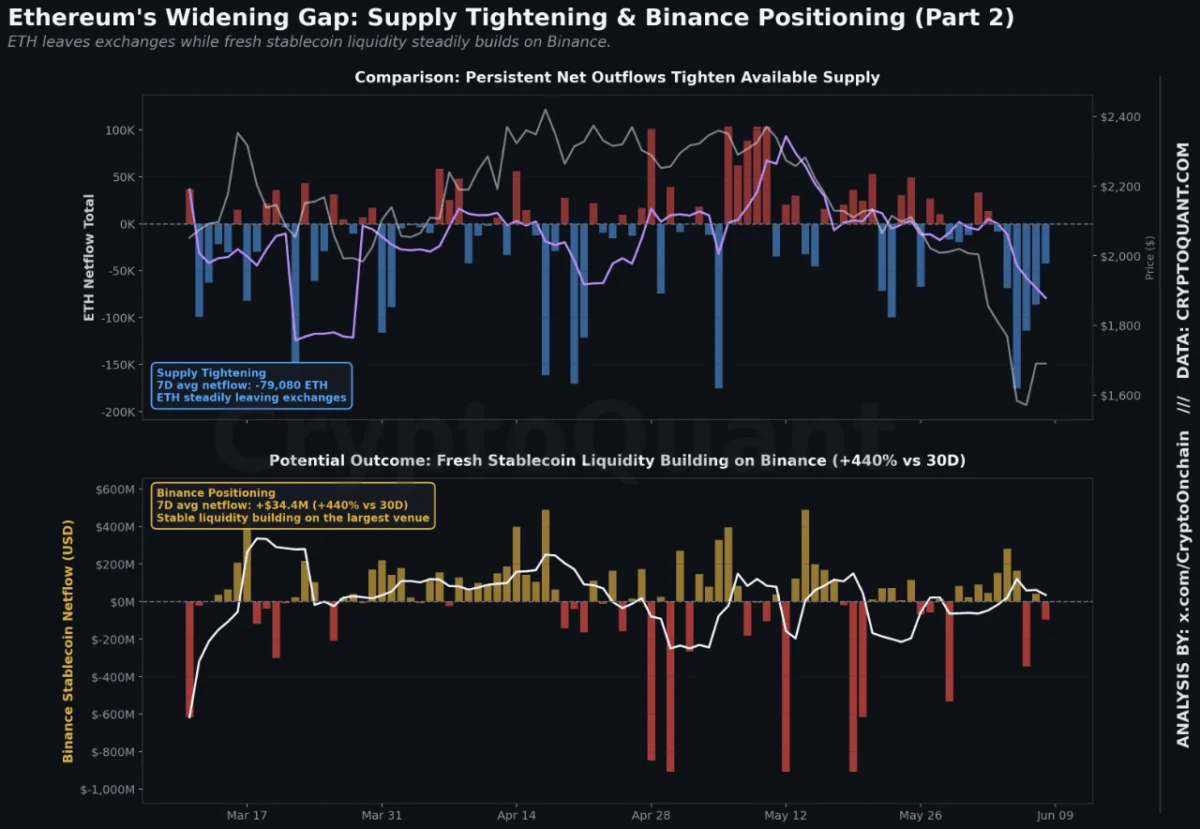
Negative ETH Netflows: Total ETH netflows remain deeply negative, standing at approximately -79,080 ETH. This indicates a consistent outflow of substantial volumes from exchanges. These outflows suggest that ETH is being moved to wallets not immediately available for sale, signifying an intent to hold or stake rather than liquidate. This ongoing process contributes to a real and tangible contraction in the available spot supply of Ethereum.

-
Positive Stablecoin Netflows into Binance: Simultaneously, fresh capital is being positioned on Binance, the world’s largest cryptocurrency exchange, through the stablecoin channel. Stablecoin netflows into Binance have turned strongly positive, registering an increase of +$34.4 million. This represents a significant 440% rise compared to the 30-day average. This inflow of stablecoins indicates that purchasing power is actively arriving on the exchange at the same time that spot ETH is being withdrawn.
-
Expanding Open Interest on Binance: Further reinforcing the notion of strategic positioning, Open Interest on Binance has expanded by approximately 9% over the quarter. This expansion confirms that larger participants are not only accumulating spot ETH but are also quietly building derivative exposure. This dual approach of spot accumulation and derivatives positioning suggests a calculated strategy to capitalize on potential future price movements.
The confluence of these data points paints a clear picture: retail participation is thinning, while larger entities are withdrawing spot ETH and simultaneously parking stablecoin liquidity on major exchanges. This creates a market structure where the available float of Ethereum is tightening from the supply side, while potential demand is steadily accumulating on the buy side.
While this structural setup does not guarantee an immediate price reversal, as catalysts are required to activate such moves, it establishes a crucial pre-condition. Historically, such tightening floats meeting concentrated buying power have preceded more pronounced market moves once demand returns. The participants who have remained active during this period of apathy are strategically positioned to benefit disproportionately when market sentiment shifts.
Ethereum Tests New Lows As Market Searches For A Bottom: A Technical Perspective
While on-chain data suggests a foundation for future growth, the immediate technical picture for Ethereum presents a more bearish outlook. On the daily timeframe, Ethereum remains firmly under bearish control, with prices trading near $1,630. This follows a sharp breakdown from the multi-month consolidation that characterized trading between February and May.
The most significant technical development has been the decisive loss of the $1,800-$1,900 support zone. This area had repeatedly acted as a demand floor throughout the first half of the year. Once this crucial support failed, selling pressure accelerated rapidly, pushing ETH to fresh yearly lows near $1,500.
Key Technical Developments:
-
Bearish Market Structure: From a market structure perspective, the sequence of highs and lows remains clearly bearish. The April-May recovery peaked near $2,400, forming a lower high relative to previous rallies, before sellers regained control. Since then, Ethereum has exhibited a pattern of lower highs and lower lows, culminating in the recent collapse through critical support levels.

-
Weakness Across Timeframes: The current price action is significantly below the 50-, 100-, and 200-day moving averages. This confirms weakness across all major timeframes, underscoring the prevailing bearish sentiment.
-
Volume Spike During Selloff: Volume behavior during the recent selloff adds another layer to the analysis. The aggressive decline generated one of the largest volume spikes seen in months, signaling significant participation as ETH broke through support. While a short-term bounce did emerge from the $1,500 area, buyers have, thus far, struggled to reclaim any meaningful resistance.
The immediate battleground for Ethereum is the $1,500-$1,550 region, which now represents the year’s most critical support level. A sustained hold at this level could allow Ethereum to build a base after experiencing a nearly 35% decline from its May highs. However, without a decisive reclaim of the former support zone around $1,800, rallies are likely to be interpreted as corrective moves within a broader downtrend rather than the inception of a durable recovery.
Chronology of Events: A Shift in Market Dynamics
The current state of Ethereum’s price action and on-chain activity can be understood by examining the recent market chronology:
- Early 2023: Ethereum experienced a period of recovery and consolidation, with prices oscillating between $1,800 and $1,900, marking a significant support zone.
- April-May 2023: A notable rally pushed Ethereum towards the $2,400 mark. However, this peak failed to establish a new higher high, signaling a potential shift in momentum.
- Late May – Early June 2023: Bearish sentiment began to reassert itself, leading to a series of lower highs and lower lows. This marked the beginning of the current downtrend.
- Recent Weeks: The market witnessed a decisive breakdown below the $1,800-$1,900 support, triggering accelerated selling pressure and pushing prices towards $1,500.
- Present: Ethereum is trading below $1,700, characterized by market apathy. Simultaneously, on-chain data reveals a divergence between declining retail transaction volume and increasing average transaction values, alongside significant ETH outflows from exchanges and stablecoin inflows into exchanges.
This chronological overview highlights a gradual shift in market dynamics, from a period of cautious optimism to a prevailing bearish sentiment, which has been exacerbated by the breakdown of key technical levels. However, the underlying on-chain data suggests that this bearish sentiment might be masking a strategic repositioning by larger market participants.
Supporting Data: A Deeper Dive into the Numbers
The analysis by CryptoOnchain and the technical indicators provide a robust dataset supporting the current market narrative.
On-Chain Transaction Data:
- Daily Transactions (Regular Wallets): -43% (indicating reduced retail activity)
- Average Value Moved per Transaction: +184% (signifying larger individual transfers)
- Median Transfer Size: Sharply increased (further confirmation of larger value movements)
Flow Data:

- Total ETH Netflows: -79,080 ETH (consistent outflows from exchanges)
- Stablecoin Netflows into Binance: +$34.4 million (440% increase vs. 30-day average; indicating capital influx)
- Open Interest on Binance: +9% over the quarter (suggesting increased derivative activity)
Technical Indicators:
- Price: Trading below $1,700, near $1,630.
- Key Support Lost: $1,800-$1,900 zone.
- Recent Lows: Near $1,500.
- Moving Averages: Price is below 50-, 100-, and 200-day moving averages.
- Volume: Significant spike during recent selloff.
This comprehensive data set provides a multi-faceted view of the Ethereum market, combining the macro trends of on-chain activity with the micro signals of price action and trading volumes.
Official Responses and Market Commentary
As of the latest reporting, there have been no direct official responses from Ethereum Foundation or major development teams regarding the current price action or on-chain data trends. The cryptocurrency market often operates with a degree of decentralization, where market participants and on-chain analytics firms are the primary sources of commentary and interpretation.
However, the insights provided by CryptoOnchain are indicative of a growing consensus among some market analysts. The divergence between declining retail engagement and increasing whale activity is a recurring theme in discussions about potential market bottoms. Analysts often point to such patterns as signs of capitulation by smaller investors, creating opportunities for larger, more patient players to accumulate assets at discounted prices.
The prevailing narrative among those who focus on on-chain analysis is one of cautious optimism, albeit tempered by the immediate technical bearishness. The idea is that while the price may continue to stagnate or even decline in the short term, the underlying network activity suggests a healthy accumulation phase, which could set the stage for a significant recovery once market sentiment shifts.
Implications for the Future of Ethereum
The current market dynamics, characterized by price stagnation and a divergence in on-chain activity, carry several significant implications for the future of Ethereum:
-
Resilience of the Network: The fact that large holders continue to move significant capital and accumulate ETH, despite the prevailing bearish sentiment, suggests a strong underlying belief in the long-term viability and value proposition of the Ethereum network. This resilience is a positive indicator for its continued development and adoption.
-
Potential for a Sharp Reversal: The observed tightening of the available float, coupled with accumulating buying power on exchanges, creates a classic scenario for a rapid price appreciation once demand returns. A swift upward movement could occur if a positive catalyst emerges, such as favorable regulatory news, significant technological upgrades, or a broader market recovery.

-
Shift in Market Dominance: The thinning of retail participation could signify a temporary shift in market dominance towards institutional and sophisticated investors. As these entities accumulate, they may exert greater influence on price discovery in the future.
-
Importance of Catalysts: While the structural setup is favorable for a potential upside move, it is crucial to remember that catalysts are essential. Without external triggers, the market could remain in its current state of apathy for an extended period. Investors and traders will be closely watching for developments that could reignite broader market interest.
-
Long-Term Holding Strategy: The current on-chain data aligns with a long-term holding strategy. For investors who believe in Ethereum’s future, the current price levels might represent an attractive accumulation phase, allowing them to acquire ETH at a discount before a potential future rally.
In conclusion, while Ethereum’s price action may appear stagnant and bearish on the surface, a deeper dive into on-chain transaction data reveals a more nuanced picture. The divergence between declining retail activity and increasing whale movements, coupled with consistent ETH outflows from exchanges and stablecoin inflows, suggests a strategic consolidation of capital. This "widening gap" between retail and whale behavior hints at a market structure poised for a significant move once demand returns, underscoring the enduring strength and strategic positioning within the Ethereum ecosystem.