Ethereum Navigates Shifting Tides: On-Chain Data Hints at Underlying Strength Amidst Market Apathy
London, UK – June 10, 2026 – The cryptocurrency market, often characterized by its rapid shifts and investor sentiment volatility, is currently witnessing a period of subdued activity for Ethereum (ETH). The digital asset has been struggling to break the crucial $1,700 resistance level, creating a sense of apathy and uncertainty that has left traders on both sides of the market feeling frustrated. While price action appears directionless, neither showing a convincing recovery nor a decisive breakdown, a deeper dive into Ethereum’s on-chain network activity reveals a more nuanced picture, suggesting that the current weakness may not reflect a fundamental decline in the network’s health.
Recent analysis by CryptoOnchain, a prominent blockchain analytics firm, has uncovered a significant divergence in Ethereum’s transaction patterns over the past week. This divergence offers a compelling counter-narrative to the prevailing sentiment of market stagnation.
The Divergence: Fewer Transactions, Greater Value
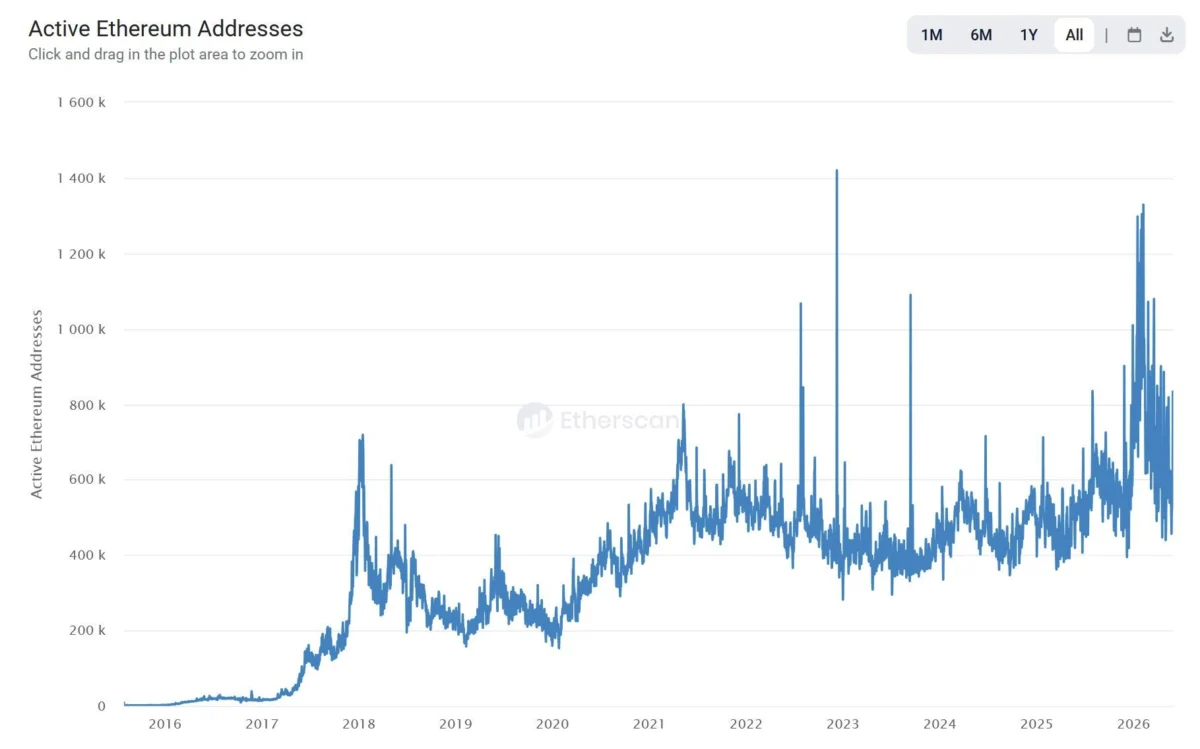
On the surface, the data presents a seemingly negative trend. Daily transactions originating from regular user wallets have seen a substantial drop of approximately 43%. In isolation, this statistic might be interpreted as a sign of declining engagement and waning relevance for the Ethereum network, especially during a challenging market period. However, this is where the analysis truly begins, moving beyond superficial observations to uncover underlying dynamics.
Crucially, this decline in transaction volume is sharply contrasted by a dramatic surge in the average value moved per transaction. This metric has ballooned by over 184%. Furthermore, the median transfer size has experienced an even more pronounced increase. In essence, Ethereum is processing fewer transactions, but each of these transactions is significantly larger than those observed in preceding periods.
Decoding the Pattern: "Whales" Accumulate While Retail Retreats
This specific combination of declining transaction counts and escalating transfer values is a recognizable pattern to those who have closely observed on-chain behavior during previous periods of market stress. The prevailing hypothesis is that smaller, routine participants, often referred to as retail investors, are stepping aside. They are reducing their activity, likely waiting for greater market clarity and a more defined trend before re-engaging.

Concurrently, larger holders, commonly known as "whales," appear to be continuing their operations. They are moving substantial capital, albeit in fewer but more significant transactions. These larger transfers are indicative of deliberate strategic positioning rather than routine network usage. This suggests that these sophisticated market participants are actively making moves, potentially accumulating assets at current price levels.
CryptoOnchain’s analysis posits that this divergence is not a symptom of a fading network but rather a clear indication of capital consolidation. It suggests that significant holdings are being concentrated into fewer, larger hands as the market navigates current price levels.
The Setup: Consolidating Foundations for Future Moves
Further supporting this thesis, CryptoOnchain’s analysis connects this transaction divergence to broader on-chain flow data, which corroborates the same behavioral pattern from multiple independent vantage points.
Netflows Paint a Picture of Supply Contraction:
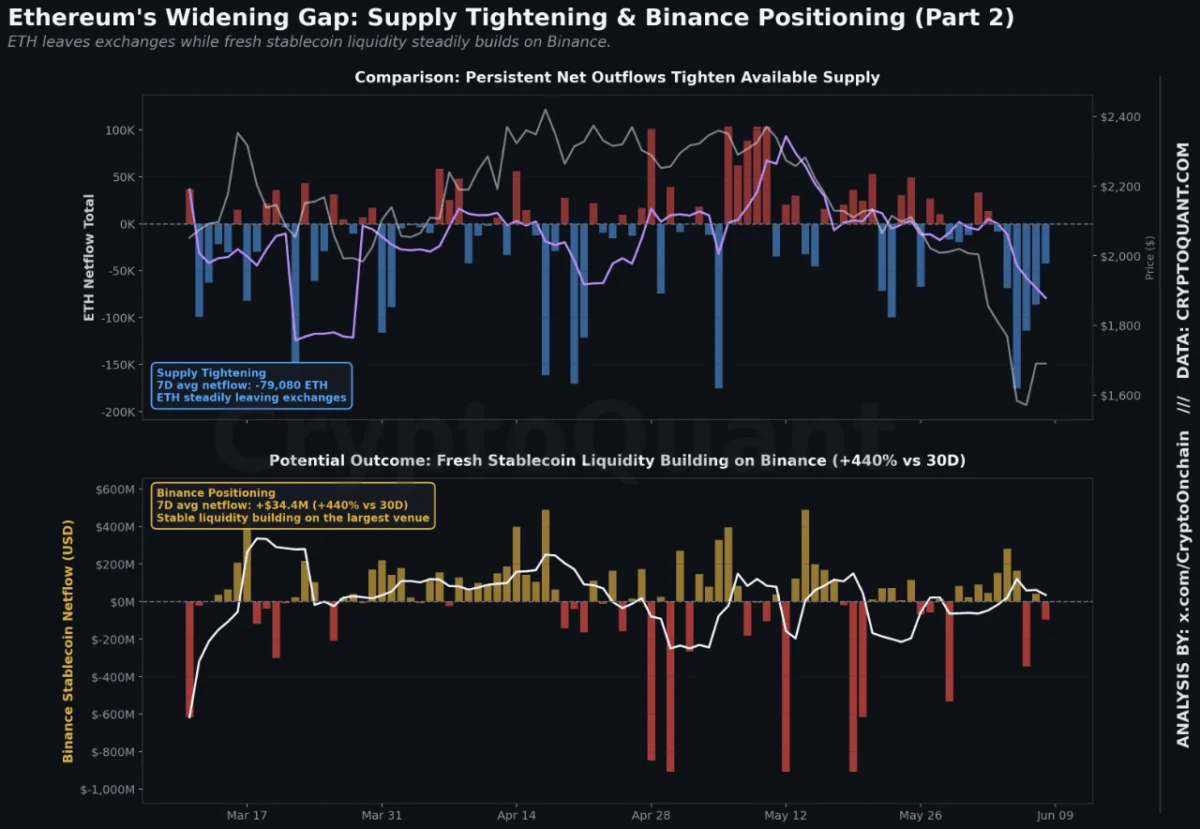
Total ETH netflows onto exchanges remain deeply negative, registering approximately -79,080 ETH. This signifies that substantial volumes of ETH are consistently leaving exchanges. This movement is crucial because ETH held on exchanges is readily available for immediate sale, whereas ETH withdrawn to private wallets represents a more committed holding. The ongoing negative netflows indicate a real and sustained contraction of the readily available spot supply of Ethereum.
Stablecoin Inflows Signal Emerging Demand:
Simultaneously, fresh capital is reportedly being positioned on exchanges, particularly on Binance, through the stablecoin channel. Stablecoin netflows into Binance have turned strongly positive, recording an increase of +$34.4 million. This represents a significant 440% surge compared to the 30-day average. The data suggests that buying power is arriving on the exchange at the precise moment that spot ETH is being withdrawn.

Open Interest Confirms Institutional Activity:
Further bolstering the narrative of accumulating buying power, Open Interest on Binance has expanded by approximately 9% over the quarter. This expansion in Open Interest, particularly in derivatives markets, confirms that larger, institutional participants are quietly building their exposure. This is occurring in tandem with the substantial stablecoin inflows, indicating a strategic approach to market positioning.
The confluence of these data points – declining retail transaction activity, significant ETH withdrawals from exchanges, substantial stablecoin inflows onto exchanges, and growing Open Interest – paints a specific and historically recognizable market structure. This combination suggests a scenario where the available supply of Ethereum is tightening from the sell-side, while potential demand is accumulating on the buy-side.
A Precursor to Volatility, Not a Guarantee
It is crucial to frame these findings with honesty and accuracy. This observed market structure does not guarantee an immediate price reversal. Structural setups, while creating favorable conditions, require catalysts to activate them and trigger pronounced market movements.
However, what this analysis does describe is a specific pre-condition that has historically preceded more significant market moves. This pre-condition is a tightening float meeting concentrated buying power in an environment where the participants who remained active during the period of apathy are strategically positioned to benefit disproportionately when market sentiment inevitably shifts.
Ethereum Tests New Lows as Market Searches for a Bottom
While on-chain data offers a more optimistic outlook on the underlying network health, the immediate price action for Ethereum remains a cause for concern. On the daily timeframe, ETH is firmly under bearish control, trading near the $1,630 mark. This follows a sharp breakdown from a multi-month consolidation phase that characterized trading between February and May.

The most significant technical development has been the decisive loss of the critical $1,800-$1,900 support zone. This area had repeatedly acted as a strong demand base throughout the first half of the year. Once this floor failed, selling pressure accelerated rapidly, pushing ETH to fresh 2026 lows, briefly touching the $1,500 level.
From a market structure perspective, the sequence of price action continues to exhibit clear bearish characteristics. The recovery observed between April and May peaked near $2,400, forming a lower high relative to previous rallies, before sellers regained control. Since then, Ethereum has been characterized by a series of lower highs and lower lows, culminating in the recent collapse through key support levels.
Importantly, the current price is trading well below the 50-, 100-, and 200-day moving averages. This widespread technical weakness across all major timeframes confirms the prevailing bearish sentiment in the short to medium term.
Volume and Support Levels: The Battle for the Bottom
Volume analysis further corroborates the recent price action. The latest sell-off was accompanied by one of the largest volume spikes seen in months, signaling aggressive participation as ETH breached crucial support levels. While a short-term bounce did emerge from the $1,500 area, buyers have, thus far, struggled to reclaim any meaningful resistance levels.
The immediate battleground for Ethereum is the $1,500-$1,550 region, which now represents the most critical support level of the year. A sustained hold at this level could potentially allow Ethereum to build a base after experiencing a nearly 35% decline from its May highs.

However, the path forward remains challenging. Unless ETH can successfully reclaim the former support zone around $1,800, any rallies are likely to be viewed as corrective moves within a broader downtrend, rather than the initiation of a durable recovery. The market’s search for a definitive bottom continues, with on-chain data providing a glimmer of hope for long-term investors amidst the short-term price volatility.
Expert Oversight and Editorial Integrity
This report adheres to bitcoinist’s rigorous editorial standards. Content is thoroughly researched and reviewed by leading industry experts and seasoned editors to ensure accuracy, impartiality, and relevance. Our commitment to trusted editorial practices underscores our dedication to providing valuable insights to our readership.
Disclaimer: This article is for informational purposes only and does not constitute financial advice. Investing in cryptocurrencies involves significant risk, and readers should conduct their own research and consult with a qualified financial advisor before making any investment decisions.