Ethereum Plunges Below $1,800 as Monthly RSI Hits Historic Lows: Are We Nearing a Cycle Bottom?
By Financial Markets Desk
Published: June 2026
Main Facts
Ethereum (ETH), the world’s leading altcoin and the backbone of decentralized finance (DeFi), has suffered a brutal market correction that has sent shockwaves through the broader digital asset ecosystem. Plunging past key psychological supports, ETH recently broke decisively below the $1,800 threshold, hitting a yearly low of $1,536 before stabilizing slightly. At the time of writing, Ethereum changes hands around $1,612, leaving market participants grappling with deeply entrenched bearish sentiment.
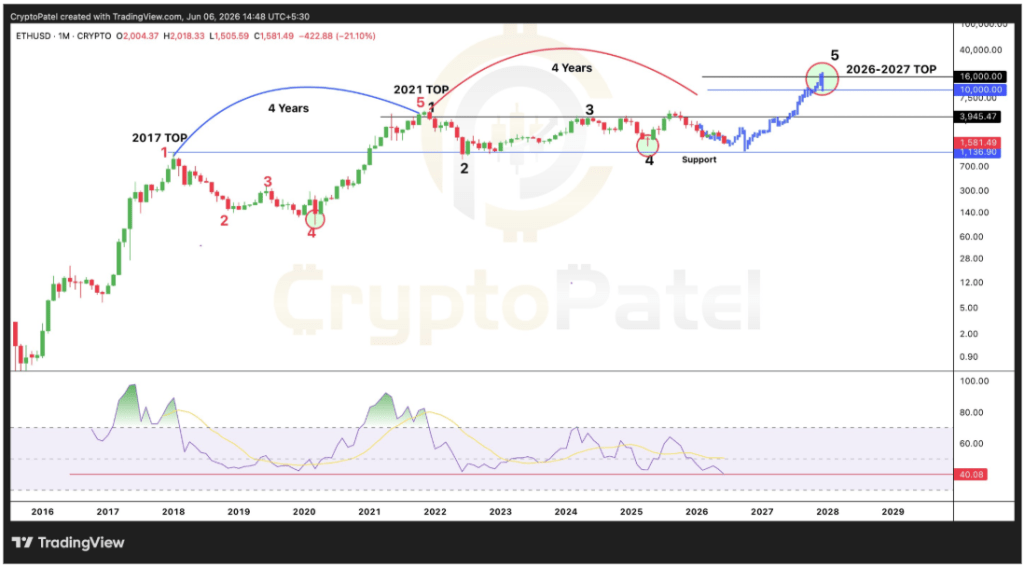
Compounding the price action is a historic technical milestone: Ethereum’s monthly Relative Strength Index (RSI) has dropped to approximately 40. This reading marks the lowest monthly RSI level in the asset’s history since its inception in 2015. While traditional technical analysts view such deep oversold conditions with extreme caution, veteran crypto traders are looking at historical analogues. Previous macro-level RSI resets in 2020 and 2022 famously preceded massive, multi-fold bull market recoveries.
Meanwhile, institutional demand remains erratic. Spot Ethereum Exchange-Traded Funds (ETFs) recently flashed a brief pulse of life by breaking a 17-day outflow streak with $19 million in net inflows on Thursday, June 4. However, that optimism evaporated almost immediately as Friday’s session reversed course, posting $5.97 million in net outflows and highlighting ongoing institutional hesitation.
Chronology: The Road to the 2026 Crash
To understand the gravity of Ethereum’s current position, it is vital to trace the asset’s trajectory over the past several years:
- August 2025: Ethereum reaches its cycle peak, touching an impressive all-time high of $4,946. Optimism across the crypto market is exceptionally high, fueled by expanding layer-2 adoption and robust institutional capital inflows.
- Late 2025 to Early 2026: Following the August apex, a persistent nine-month downtrend takes hold. Macroeconomic pressures, regulatory headwinds, and shifting risk appetites across global markets trigger a slow but relentless bleed in digital asset valuations.
- June 2026: The bearish structure collapses into a cascading sell-off. Ethereum breaches the critical $1,800 floor, culminating in an intra-day crash to $1,536—its lowest valuation of 2026. This aggressive downward momentum pushes the monthly RSI down to historic lows near 40.
- Early June 2026 (ETF Dynamics): Spot Ethereum ETFs experience a prolonged 17-day outflow streak before registering a modest $19 million inflow on Thursday, June 4. The relief is short-lived, as outflows return the following day, illustrating a fragile market structure.
Supporting Data: Historical Parallels and Technical Indicators
The core narrative surrounding Ethereum’s current technical posture centers on the monthly Relative Strength Index (RSI). As a momentum oscillator, the RSI measures the speed and change of price movements on a scale from 0 to 100. Historically, a reading dropping toward or below 40 on a high-timeframe monthly chart is exceptionally rare for major assets.
1. The 2020 Precedent
During the COVID-19 market crash in March 2020, Ethereum experienced a localized panic that drove its price down to roughly $88. The monthly RSI flashed a deep reset. What followed was one of the most explosive bull runs in crypto history, with ETH surging from double digits to a peak above $4,800 in 2021.

2. The 2022 Bear Market Bottom
Following the cycle peak in late 2021, the crypto market endured a crushing crypto winter throughout 2022, triggered by macroeconomic tightening and high-profile industry bankruptcies (such as FTX). Ethereum’s price retraced to an interim cycle low around $880, accompanied by another significant compression in the monthly RSI. This reset laid the groundwork for the structural accumulation phase that eventually carried ETH back up to its $4,946 all-time high in August 2025.
3. The 2026 Anomaly: Deeper Than Ever Before
The current 2026 setup shares striking structural similarities with 2020 and 2022, but with a critical caveat: the monthly RSI has dropped even lower than in previous cycle corrections. Because this reading represents the most extreme oversold territory in Ethereum’s history, analysts suggest that if historical cyclicality repeats itself, the subsequent macro recovery phase could yield outsized percentage gains compared to previous cycles.
Long-term structural models, such as the four-year macro cycle framework, point toward a possible long-term target projection as high as $10,000 for a future cycle peak anticipated between 2026 and 2027, provided the current phase ultimately mirrors past accumulation bottoms.
Official Responses and Market Commentary
Market analysts, quantitative researchers, and prominent crypto commentators have offered mixed interpretations of Ethereum’s current predicament.
Prominent crypto analyst CryptoPatel, whose charts highlighted the historic monthly RSI drop on X (formerly Twitter), noted that extreme momentum zones of this magnitude have historically aligned with macro market bottoms rather than cycle tops. However, institutional analysts warn that technical indicators alone cannot offset prevailing macroeconomic headwinds.
"While historical cycle charts give us a fascinating roadmap, we cannot ignore the immediate liquidity environment," noted a senior digital asset strategist at a London-based crypto fund. "Interest rates, global liquidity contractions, and the inconsistent behavior of Spot ETH ETF flows mean that bulls cannot rely on RSI alone to save the market."
Institutional sentiment remains deeply divided. While legacy financial institutions continue to monitor Ethereum’s robust developer ecosystem and enterprise utility, short-term capital allocators remain defensive, waiting for clear signals of sustained institutional inflows before committing fresh capital.
Implications for Investors and the Broader Market
The convergence of multi-month price declines, historic RSI lows, and unstable ETF flows carries profound implications for various market participants:
1. For Retail Investors and Swing Traders
The immediate battleground for Ethereum bulls lies at the $1,600 support zone. Failing to defend this region could invite deeper cascading liquidations toward the psychological $1,500 and $1,400 levels. Conversely, aggressive buyers willing to accumulate during extreme fear zones may find themselves positioned at historical cycle lows, mirroring the generational buying opportunities presented in late 2018, March 2020, and late 2022.
2. For Institutional Players and ETF Holders
The choppy performance of Spot Ethereum ETFs underscores the cautious approach institutional investors are taking toward altcoins. Until net inflows stabilize over a multi-week period rather than isolated single-day spikes, institutional accumulation will likely remain subdued.
3. For the Decentralized Finance (DeFi) and Layer-2 Ecosystems
Price crashes below $1,800 inevitably trigger stress tests across Ethereum-based lending protocols, collateralized debt positions (CDPs), and liquid staking platforms. Increased liquidations can temporarily strain network congestion and gas fee dynamics, though core network fundamentals, staking yields, and layer-2 scaling adoption continue to operate independently of short-term price volatility.
Conclusion
Ethereum stands at a critical historical crossroads. While the psychological pain of plunging below $1,800 and printing historic monthly RSI lows cannot be understated, the asset’s macro cycle history suggests that periods of maximum technical capitulation have historically signaled the quiet accumulation phase before the next major market expansion. Whether history will rhyme once more depends heavily on the bulls’ ability to defend the $1,600 floor and reclaim sustained institutional momentum in the months ahead.