Ethereum Plunges Below $1,800: Historic Monthly RSI Drop Sparks Debate Over Cycle Bottoms and Future Expansion
By Financial Markets Desk
Published: June 2026
1. Main Facts
Ethereum (ETH), the world’s leading altcoin and the foundational backbone of decentralized finance (DeFi) and smart contracts, has suffered a severe market correction. The asset’s price has plummeted below the crucial psychological threshold of $1,800, dragging the broader cryptocurrency market sentiment deeper into a bearish cycle.
Over the past 24 hours, Ethereum hit a low of $1,536—marking its weakest price performance of 2026. At the time of reporting, the asset trades at approximately $1,612, placing intense pressure on market bulls to defend the $1,600 support line.
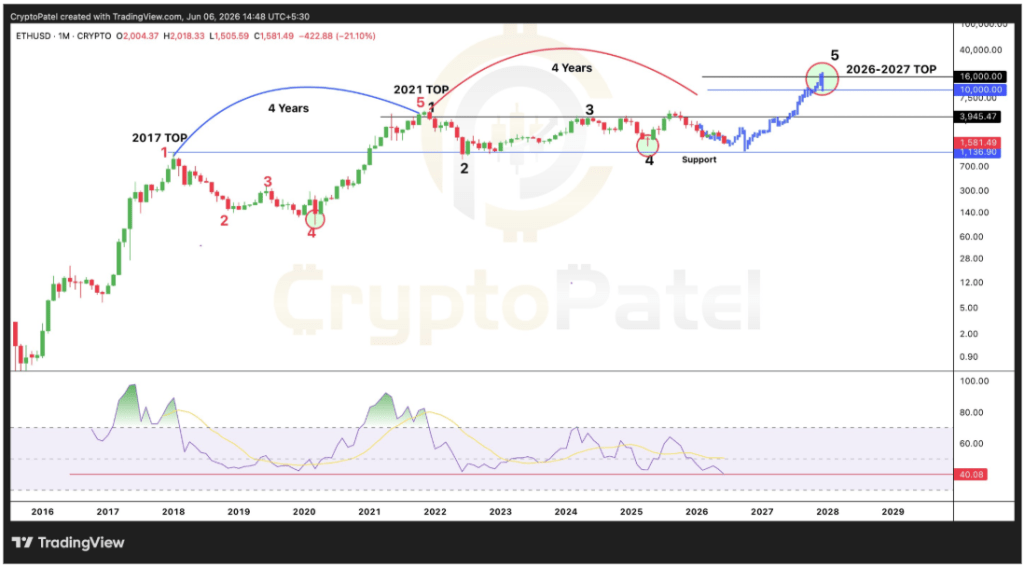
Compounding the bearish price action is a historic technical indicator milestone. Ethereum’s monthly Relative Strength Index (RSI)—a key momentum oscillator used to measure the speed and change of price movements—has plunged to roughly 40. This is the lowest monthly RSI reading recorded in the asset’s history since its public launch in 2015.
While this deep momentum reset has triggered panic among short-term retail traders, long-term technical analysts are scrutinizing historical chart patterns. Similar extreme monthly RSI resets preceded explosive market bottoms in both 2020 and 2022, paving the way for monumental bull runs. As institutional products like Spot Ethereum ETFs experience choppy, inconsistent inflows, the market stands at a precarious crossroads between prolonged depression and a historic cycle accumulation phase.
2. Chronology: The Road to the 2026 Slump
To understand the gravity of Ethereum’s current position, market observers must look back at the arduous trajectory that brought the asset to its mid-2026 lows.

- August 2025 (The Peak): Ethereum reached its previous all-time high of $4,946, capping off a massive multi-year expansion driven by institutional adoption, Layer-2 scaling maturation, and macroeconomic tailwinds.
- Late 2025 to Early 2026 (The Descent): Following the August peak, Ethereum entered a brutal nine-month downtrend. Macroeconomic pressures, regulatory scrutiny, and cooling speculative enthusiasm steadily eroded ETH’s valuation, breaking through several key support levels.
- June 2026 (The Breakdown): The downward pressure accelerated sharply in June. Ethereum breached the $1,800 psychological floor, tumbling to an intra-day low of $1,536—the lowest price point observed since the start of the year.
- June 4, 2026 (A Brief ETF Respite): Spot Ethereum ETFs momentarily halted a 17-day consecutive streak of bleeding capital, logging $19 million in net inflows on Thursday, June 4. However, the relief proved fleeting.
- June 5, 2026 (Return to Red): Momentum reversed immediately during the subsequent Friday trading session, which saw $5.97 million in net outflows, confirming that institutional confidence remains fragile.
3. Supporting Data and Technical Analysis
The structural integrity of Ethereum’s macro chart is currently defined by two competing narratives: severe current weakness and unprecedented historical parallels.
The Monthly RSI Anomaly
The monthly RSI measures momentum over long horizons, filtering out daily market noise. Historically, Ethereum’s monthly RSI rarely dips deep into oversold or lower neutral zones unless the asset is experiencing a cyclical capitulation event.
With the monthly RSI dropping to approximately 40, the indicator has reached unprecedented depths relative to Ethereum’s 11-year trading history. Technical analysts note that previous major cycle resets occurred under remarkably similar conditions:
- The 2020 Reset: Prior to the explosive 2020–2021 bull run, Ethereum’s RSI plummeted before initiating a dramatic rally from around $88 to an apex above $4,800.
- The 2022 Reset: Following the post-2021 correction, another deep RSI reset occurred when ETH traded near $880, laying the groundwork for the rally that culminated in the $4,946 all-time high of August 2025.
Macro Cycle Projections and the $10,000 Target
Long-term technical analysis of the monthly candlestick timeframe suggests that Ethereum continues to respect a four-year macro cycle structure, mirroring the cadence of its previous bull market peaks in 2017 and 2021.
Proponents of this cycle theory argue that the current flush-out is merely the final cyclical cleansing phase before a massive structural expansion. Some analysts have mapped out projections suggesting that if historical fractals play out, a subsequent impulsive wave could target a cycle peak in the $10,000 range between late 2026 and 2027.
However, technical analysts are quick to caution that historical patterns do not guarantee future performance. A breakdown below the current $1,500–$1,600 support band could invalidate macro recovery models and usher in a prolonged crypto winter.
4. Institutional Sentiment and Official Market Responses
The institutional landscape surrounding Ethereum presents a mixed picture. While on-chain metrics show aggressive accumulation by high-net-worth "whale" addresses buying the dip, traditional financial vehicles tell a story of hesitation.
Spot Ethereum exchange-traded funds (ETFs) have struggled to maintain positive momentum. The 17-day outflow streak that ended on June 4 highlighted a widespread risk-off sentiment among traditional institutional allocators. Speaking on the state of institutional inflows, market strategists note that traditional finance (TradFi) participants remain sensitive to broader macroeconomic cues, including Federal Reserve interest rate decisions and shifting regulatory frameworks in the United States and Europe.
- Analyst Commentary: Market analysts tracking the derivatives space note that funding rates across major centralized exchanges have neutralized, indicating that excessive leverage has been effectively scrubbed from the system. This deleveraging, while painful in the short term, typically reduces the risk of cascading liquidation liquidations and sets a healthier foundation for a genuine market recovery.
- DeFi Health: Despite the steep drop in token price, Ethereum’s underlying network fundamentals remain active. Total Value Locked (TVL) across Layer-1 and Layer-2 scaling solutions like Arbitrum, Optimism, and Base continues to process billions of dollars in daily economic activity, signaling that utility remains robust even as speculative fervor wanes.
5. Market Implications and Future Outlook
Ethereum’s descent below $1,800 and the historic collapse of its monthly RSI carry profound implications for both short-term speculators and long-term ecosystem stakeholders.
Short-Term Vulnerabilities
In the immediate term, market participants are watching the $1,600 level like a hawk. If bulls fail to defend this region with sustained buying volume, Ethereum risks retesting lower historical demand zones, potentially exposing the asset to extended consolidation periods. The fragility of Spot ETF inflows indicates that immediate upside catalysts are lacking, leaving the asset vulnerable to broader macroeconomic shocks or equity market corrections.
Long-Term Opportunities
Conversely, contrarian investors view the extreme RSI reading as a textbook "blood in the streets" accumulation opportunity. In financial history, generational wealth is rarely built by buying assets at all-time highs during periods of euphoria; rather, it is forged during moments of deep capitulation when sentiment is overwhelmingly pessimistic.
If Ethereum’s historical cycle behavior repeats, the current correction will be remembered not as the death of the asset, but as the ultimate macroeconomic reset before its next major multi-year expansion phase. Whether ETH can reclaim its bullish momentum and challenge ambitious long-term targets like $10,000 will depend heavily on macro liquidity conditions, institutional adoption returning to regulated products, and the continuous organic growth of its thriving developer ecosystem.