
Ethereum Plunges Below $1,800: Historic RSI Reset Sparks Debate Over Cycle Bottom and Future Recovery
By Financial Markets Desk
June 2026
Executive Summary & Main Facts
The broader cryptocurrency market is currently gripped by an intensely bearish sentiment, and Ethereum (ETH), the world’s leading altcoin, has borne the brunt of this downward pressure. In a brutal market correction that has erased billions in market capitalization over the past nine months, Ethereum’s price officially plunged below the psychological and technical threshold of $1,800.
During the latest cascading sell-off, ETH tumbled to an intraday low of $1,536—marking its weakest price point of 2026. At the time of publication, the asset is stabilizing near $1,612, leaving market participants scrambling to assess whether this breakdown represents a terminal capitulation event or the prelude to a deeper structural decline.
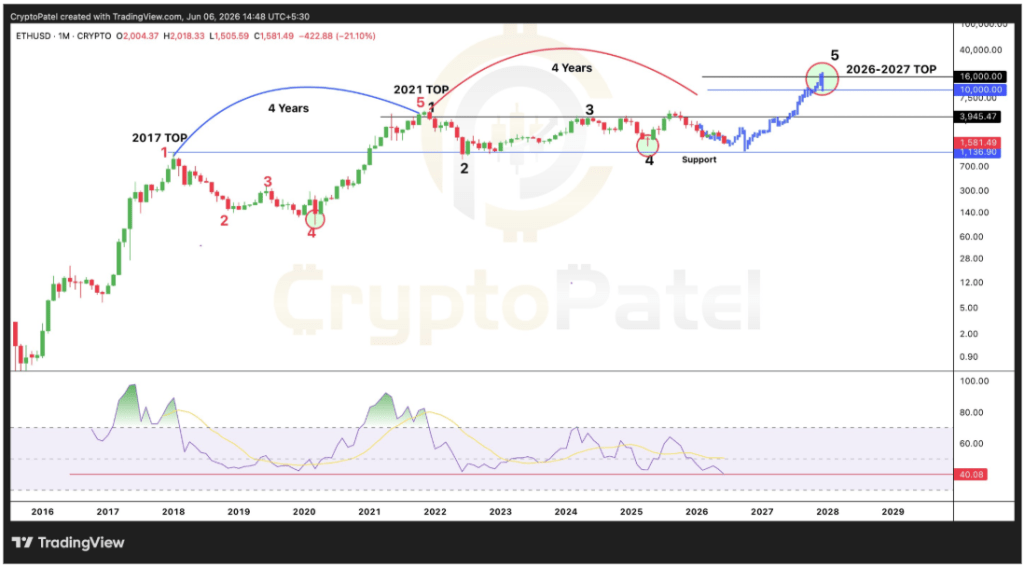
Compounding the gravity of this price action is a historic technical milestone: Ethereum’s monthly Relative Strength Index (RSI) has plummeted to approximately 40. This is the lowest reading recorded on the monthly timeframe since the asset’s inception in 2015.
While the overarching market mood is undeniably pessimistic, seasoned technical analysts are closely monitoring these depressed momentum levels. Historically, extreme RSI resets on higher timeframes have preceded some of Ethereum’s most explosive secular bull runs, specifically acting as the launching pad for cycle lows in 2020 and 2022.
As bulls desperately attempt to defend the $1,600 support zone, institutional flows remain volatile, and the debate intensifies: Is Ethereum experiencing a catastrophic cycle failure, or is this the final, painful consolidation phase before a historic multi-thousand-dollar market expansion toward a projected $10,000 target?
Chronology of the Downtrend: From 2025 Peaks to 2026 Capitulation
To understand the severity of Ethereum’s current market standing, one must examine the timeline of its trajectory over the last year. The transition from exuberant highs to gut-wrenching lows highlights the volatile nature of digital asset market cycles.

- August 2025 (The Cycle Peak): Ethereum reached its all-time high of $4,946, capping off a multi-year recovery rally that began in the depths of the 2022 bear market. Optimism was rampant, with widespread institutional adoption, expanding Layer-2 ecosystems, and the continuous growth of decentralized finance (DeFi) driving valuations upward.
- Late 2025 to Early 2026 (The Prolonged Correction): Following the August peak, ETH entered a grinding nine-month downtrend. Macroeconomic headwinds, waning retail participation, and rotating liquidity dampening the broader crypto market systematically eroded Ethereum’s gains. Lower highs and lower lows became the dominant trend on the weekly and monthly charts.
- June 2026 (The Sub-$1,800 Breakdown): The downward pressure accelerated sharply in June. Ethereum breached critical support lines, decisively falling below the $1,800 mark. The cascading liquidations culminated in a flash low of $1,536, sending shockwaves through leveraged derivatives markets and triggering panic selling across retail segments.
- Current Standing (Mid-June 2026): ETH is changing hands around $1,612. Market participants are watching whether the $1,600 support level can hold as a structural foundation for accumulation, or if the asset will test even lower historical supports near the psychological $1,500 boundary.
Supporting Data & Technical Analysis: Unprecedented RSI Depressions
From a technical perspective, Ethereum’s price action is telling a story that extends far beyond short-term market noise. The primary focal point for institutional chartists is the monthly Relative Strength Index (RSI)—a momentum oscillator that measures the speed and change of price movements on a scale from 0 to 100.
The Historic Monthly RSI Reset
Following the collapse below $1,800, the ETH/USD monthly RSI dropped to a reading of roughly 40. For an asset with a trading history dating back to 2015, this represents the lowest monthly RSI level ever printed.
In traditional technical analysis, an RSI reading approaching or dropping below historical averages signifies profound oversold conditions. However, on a macro timeframe like the monthly chart, such extreme readings are exceedingly rare. They typically occur only during systemic market panics or generational cycle bottoms.
Historical Precedents: 2020 and 2022
Market historians are drawing parallels between the current technical setup and two previous major cyclical bottoms:
- The March 2020 COVID-19 Crash: Ethereum experienced a severe macro reset that pushed momentum indicators to deeply depressed levels. Following that flush-out, ETH embarked on a legendary bull run, surging from approximately $88 to its 2021 peak of over $4,800.
- The 2022 Bear Market Bottom: Following the collapse of major crypto entities and macro tightening by global central banks, Ethereum’s RSI reached compressed levels near cycle lows. This preceded a recovery rally that lifted ETH from roughly $880 to its August 2025 all-time high of $4,946.
The Macro Four-Year Cycle and Long-Term Projections
Technical analysis of the monthly candlestick timeframe reveals that Ethereum continues to respect a macro four-year cycle pattern, mirroring the structural movements observed between the 2017 peak and the 2021 peak.
Proponents of this cyclical theory argue that structural market resets are healthy prerequisites for subsequent expansions. Long-term forecasting models—such as the projected "golden triangle" trajectories—suggest that if historical cycle pacing holds true, the current macroeconomic storm could lay the groundwork for a speculative top in the $10,000 range sometime between late 2026 and 2027. However, analysts emphasize that these targets require a complete reversal of current macro sentiment and robust capital inflows.
Institutional Dynamics: Spot ETF Inflows and Outflows
While retail sentiment has turned decidedly defensive, institutional behavior through Spot Ethereum Exchange-Traded Funds (ETFs) provides a mixed, highly nuanced picture of market demand.
The Short-Lived Relief Rally
On Thursday, June 4, the institutional landscape showed a momentary glimmer of hope. Spot Ethereum ETFs snapped a stubborn 17-day consecutive streak of net outflows, recording $19 million in positive net inflows. For bulls desperately searching for a catalyst to halt the bleeding, this sudden influx of institutional capital was interpreted as a potential signal that institutional buyers were beginning to view sub-$1,800 ETH as an attractive long-term value play.
Immediate Reversion to Outflows
That optimism, however, proved short-lived. The very next trading session on Friday erased the prior day’s gains, with Spot Ethereum ETFs returning to negative territory by recording $5.97 million in net outflows.
This back-and-forth action underscores the fragile nature of current institutional participation. Rather than committing to aggressive, sustained accumulation phases, institutional investors remain highly reactive to short-term macroeconomic data releases, regulatory developments, and broader risk-off sentiments across global financial markets.
Market Implications and Outlook
The convergence of sub-$1,800 valuations, a record-low monthly RSI, and erratic institutional ETF flows presents both severe risks and unique strategic implications for the cryptocurrency ecosystem.
The Bearish Case: Risk of Further Capitulation
Bears argue that historical patterns do not guarantee future performance. In an environment defined by persistent macroeconomic tightening, liquidity contraction, and declining risk appetite, technical indicators can remain depressed for extended periods. If the $1,600 support level fails to hold, analysts warn that cascading liquidations could drag Ethereum down toward deeper historical support zones, invalidating the multi-year cycle thesis and prolonging the crypto winter well into late 2026.
The Bullish Case: The Ultimate Accumulation Zone
Conversely, contrarian investors and long-term accumulators view the current extreme RSI reading as a textbook capitulation phase. Historically, buying when "blood is in the streets" and momentum indicators hit all-time lows has yielded the highest risk-adjusted returns over a 2-to-3-year investment horizon. If the current macro reset mirrors the structural bottoms of 2020 and 2022, today’s depressed prices may ultimately be viewed in hindsight as the final generational buying opportunity before Ethereum’s next major macro expansion.
Summary Checklist for Market Participants
- Key Support Level to Defend: $1,600 region.
- Immediate Resistance: Reclaiming $1,800 to restore short-term bullish momentum.
- Technical Indicator of Note: Monthly RSI at ~40 (historic low since 2015).
- Institutional Sentiment: Highly volatile, characterized by alternating days of minor ETF inflows and outflows.
As the market navigates this critical juncture, all eyes remain locked on whether Ethereum bulls can successfully defend structural support, or if macroeconomic headwinds will force the leading altcoin into an even deeper cyclical correction.