
Ethereum’s Historic RSI Plunge: A Prelude to Recovery or the End of a Cycle?
The global cryptocurrency market is currently grappling with a wave of intense bearish sentiment, and at the epicenter of this turbulence is Ethereum (ETH). After a sustained nine-month downtrend that has stripped significant value from the asset, Ethereum has breached a critical psychological support level of $1,800. This breakdown has sent shockwaves through the investor community, but beneath the surface of the price charts, a more nuanced—and potentially more bullish—narrative is emerging.
For the first time since its inception in 2015, Ethereum’s monthly Relative Strength Index (RSI) has plummeted to levels previously unseen, reaching a reading of approximately 40. While technical analysts typically view such drops as a sign of extreme weakness, historical precedence suggests that these “reset” phases have historically acted as the foundation for the most explosive rallies in the asset’s history.
Main Facts: The Anatomy of the 2026 Crash
The current price action of Ethereum is the culmination of a protracted bear market that began following the asset’s peak at $4,946 in August 2025. Over the subsequent nine months, Ethereum has struggled to maintain its footing, facing constant downward pressure from macroeconomic headwinds and shifting investor risk appetite.
As of early June 2026, the situation intensified as ETH broke decisively below the $1,800 floor. In the most recent 24-hour window, the leading smart-contract platform hit a low of $1,536—a price level that represents its weakest performance in the calendar year 2026.
The most alarming metric currently circulating among institutional and retail traders is the monthly RSI. In technical analysis, the RSI measures the speed and change of price movements on a scale of 0 to 100. A reading below 30 is typically considered "oversold," suggesting that the asset has been punished beyond its fundamental value. While the current reading of 40 is not technically in the deep "oversold" territory of sub-30, its significance lies in its historical context: it is the lowest monthly RSI reading since Ethereum began trading nearly a decade ago.
A Chronology of the Downtrend
To understand where Ethereum stands today, one must look at the timeline of the current cycle.
- August 2025: Ethereum reaches a cycle high of $4,946, buoyed by optimistic market sentiment and the expansion of the DeFi and NFT sectors.
- September 2025 – February 2026: A slow, agonizing bleed begins. As the broader crypto market loses liquidity, Ethereum experiences a series of lower highs and lower lows, signaling a shift from a bull to a bear market regime.
- March 2026: The $2,500 support level, once considered impregnable, fails to hold, leading to an accelerated sell-off.
- June 2026: The price officially breaks the $1,800 barrier. Within days, the asset tests the $1,500 range, forcing traders to re-evaluate the strength of the current market floor.
This timeline reflects a typical "distribution" phase followed by an "accumulation" or "capitulation" phase. Current market participants are now asking whether the $1,500–$1,600 range serves as the final capitulation point before a multi-year recovery begins.

Supporting Data: The Power of the RSI Reset
Historical data provides a compelling, if cautious, argument for the bulls. Throughout Ethereum’s existence, deep resets in the monthly RSI have consistently correlated with the formation of major market cycle bottoms.
In 2020, Ethereum’s RSI reached a depressed level that preceded a monumental surge. From a base of approximately $88, Ethereum embarked on an epic climb that saw it peak at over $4,800 in 2021. The pattern repeated itself in 2022, when another significant RSI reset occurred. At that time, Ethereum found a floor near $880 before eventually rallying to establish its 2025 all-time high.
While technical analysts are quick to remind investors that “past performance is not indicative of future results,” the mathematical extremity of the 2026 RSI reading is notable. Because the current reading is the lowest in the history of the asset, some market observers speculate that the intensity of the current "oversold" signal could imply that the forthcoming recovery—whenever it begins—might possess even greater velocity than its predecessors.
The Institutional Lens: ETF Inflows and Market Sentiment
The sentiment surrounding Ethereum is not solely driven by retail traders; institutional activity, particularly through Spot Ethereum ETFs, provides a clearer picture of professional positioning.
The ETF landscape has been a rollercoaster of hope and disappointment. For 17 consecutive sessions, the ETFs experienced a streak of net outflows, indicating that institutional investors were actively reducing exposure to Ethereum. However, a brief glimmer of hope appeared on Thursday, June 4, when the market recorded $19 million in net inflows.
This, unfortunately, proved to be a "false dawn." By Friday’s session, the trend reversed again, with $5.97 million in net outflows reported. This tug-of-war highlights the fragility of the current market. Without sustained institutional inflows to act as a buffer, the price remains highly susceptible to "whales" and market makers pushing the price lower to liquidate leveraged long positions.
Implications: Preparing for the Next Cycle
If the four-year cycle theory holds—a hypothesis that suggests crypto markets move in roughly four-year patterns based on market maturation—the current environment may be the final phase of the bear market.
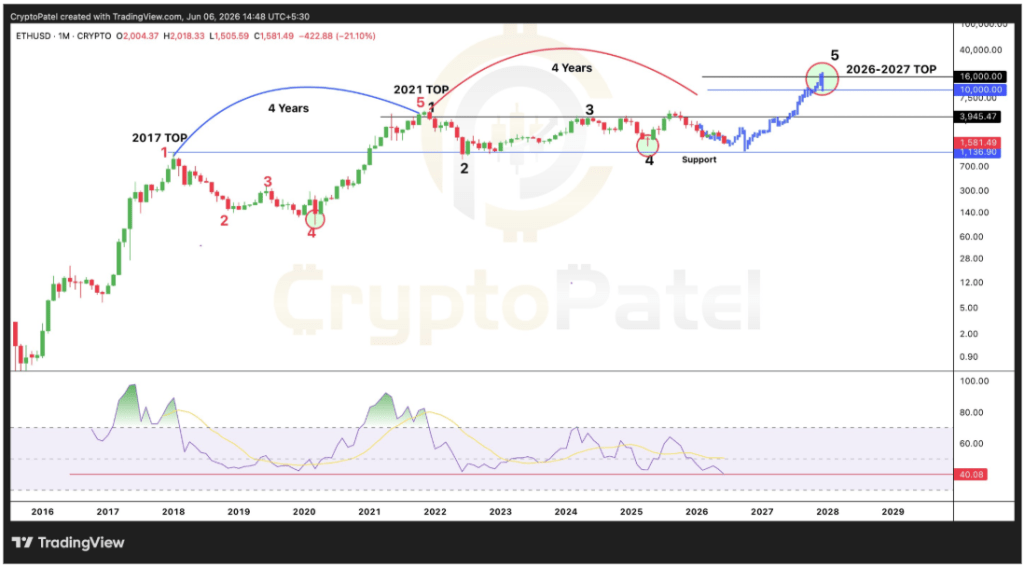
Proponents of this theory point to the projection of a potential cycle peak in the $10,000 range, targeted for 2026-2027. This projection assumes that the current extreme negative sentiment is merely the "darkest hour before dawn." However, achieving such a target requires more than just historical patterns; it requires a fundamental shift in the macro-environment, including potential interest rate pivots by the Federal Reserve and a resurgence in on-chain activity.
For the immediate future, the task for the "bulls" is clear: defend the $1,600 support region at all costs. If this level fails, the next major support levels are significantly lower, which could exacerbate the negative RSI signal and potentially prolong the time required for a market recovery.
The Role of Market Psychology
Market psychology plays a crucial role in these moments. The "fear" present in the current market, as indicated by the lowest RSI in history, often leads to "forced selling." When investors reach their limit, they sell into the bottom, which is exactly the liquidity that institutional "smart money" often looks for to build long-term positions.
Conclusion: A Critical Juncture
Ethereum stands at a historic crossroads. The confluence of a record-low monthly RSI and a sustained breakdown below $1,800 makes this one of the most significant moments in the asset’s history. While the immediate outlook is bearish and defined by volatile outflows, the historical precedent of deep RSI resets provides a potential blueprint for a significant recovery.
Investors are advised to watch the $1,600 support level closely. A hold in this area, combined with a sustained reversal in ETF flows, could signal the start of a trend reversal. Conversely, a failure to stabilize could confirm that the market requires more time in the "doldrums" before a new cycle can begin. As Ethereum enters the next phase of its lifecycle, the market remains a volatile arena, rewarding those who can distinguish between fleeting price movements and the structural shifts that define the long-term trajectory of decentralized finance.