Ethereum’s Silent Shift: Behind the On-Chain Divergence Amidst Market Apathy
The current state of the Ethereum (ETH) market is defined by a palpable sense of apathy. Trading largely stagnant below the $1,700 threshold, the second-largest cryptocurrency by market capitalization has left participants frustrated. The price action is neither a capitulation into a death spiral nor a spirited recovery; instead, it is a period of directionless consolidation. However, beneath this veneer of retail indifference, sophisticated on-chain data provided by CryptoOnchain and CryptoQuant reveals a structural transformation that contradicts the narrative of a network in decline.
The Core Divergence: A Tale of Two User Bases
A startling phenomenon has emerged within Ethereum’s transaction architecture over the last seven days. On the surface, the raw data appears grim: daily transactions originating from standard retail wallets have plummeted by approximately 43%. In a traditional market analysis, such a contraction in activity would be interpreted as a hallmark of waning network relevance and declining user interest.
Yet, a deeper dive into the transaction values tells a vastly different story. While the frequency of transactions has dropped, the average value moved per transaction has surged by over 184%. Even more telling is the median transfer size, which has seen an even sharper escalation.
This creates a clear, binary market dynamic: the "retail" crowd is stepping aside, paralyzed by uncertainty and the lack of short-term price momentum. Simultaneously, "whale" entities and institutional-grade participants are not only remaining active but are intensifying their footprint. They are processing fewer transactions, but these transactions are significantly larger in scale, suggesting that capital is being consolidated into fewer, more deliberate hands. This shift represents a transition from high-frequency, routine network usage to strategic, high-value capital allocation.

Chronology of the Breakdown: From $2,400 to the Current Floor
To understand the current positioning, one must look at the timeline of the 2026 correction. The narrative of Ethereum’s weakness is rooted in a technical breakdown that began in the spring.
The Spring Erosion (February – May)
For much of the first half of the year, Ethereum maintained a fragile stability between $1,800 and $1,900. This zone served as the primary line of defense for the bulls, absorbing consistent sell-side pressure. The market structure, however, was fundamentally flawed. During the April-May recovery period, ETH failed to surpass its previous highs, peaking near $2,400 before establishing a lower high.
The June Collapse
In early June, the $1,800 support level—a critical psychological and technical threshold—was decisively lost. The failure of this floor triggered a cascade of liquidation, forcing the asset down toward the $1,500 level. This move confirmed a bearish sequence of lower highs and lower lows, placing ETH well below its 50-, 100-, and 200-day moving averages.
Current Status
As of the current trading window, Ethereum is attempting to establish a base in the $1,500 to $1,550 range. The technical landscape remains precarious, as the asset has yet to reclaim any meaningful resistance levels, leaving rallies to be interpreted as mere corrective dead-cat bounces rather than a structural reversal.

Supporting Data: The Liquidity Squeeze
The divergence in transaction behavior is not occurring in a vacuum. It is supported by two distinct data streams that point toward a supply-side crunch.
Exchange Netflows
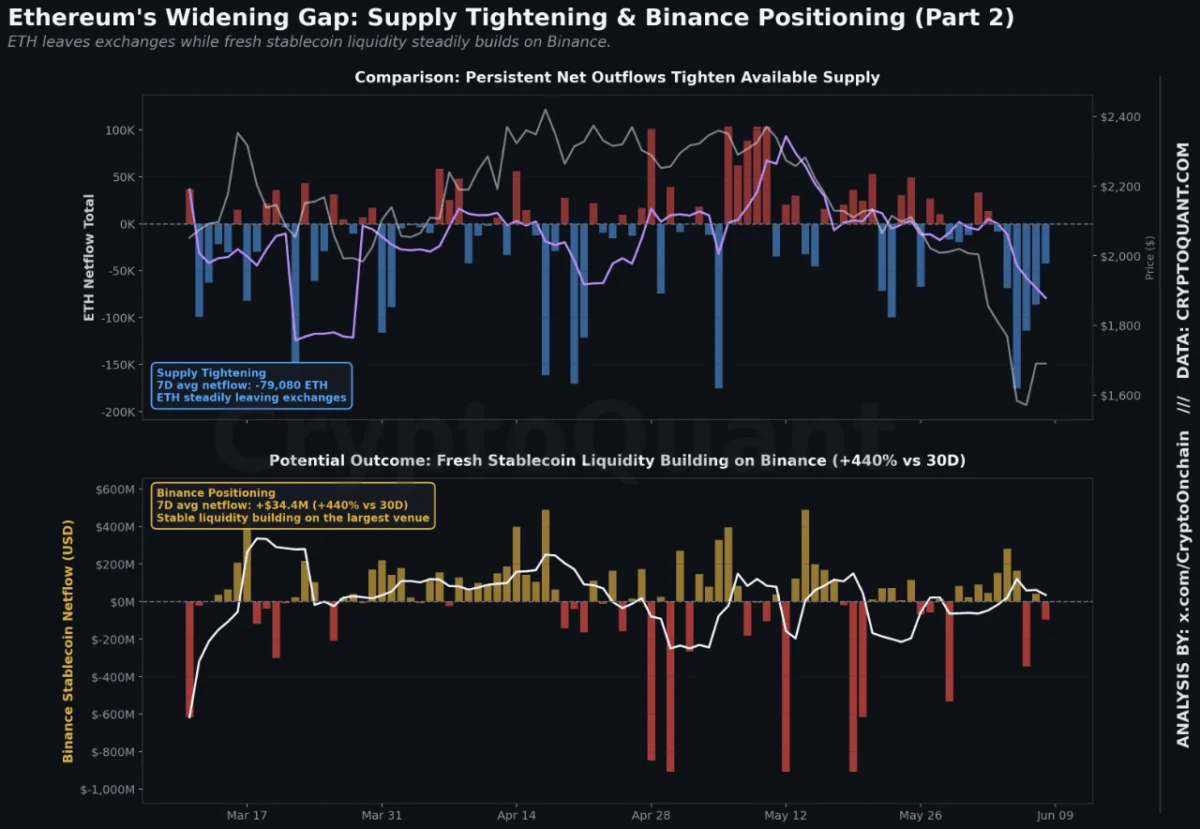
Total ETH netflows remain firmly in the negative, currently hovering around -79,080 ETH. This indicates that large volumes of Ethereum are being withdrawn from centralized exchanges and moved into cold storage or DeFi protocols. By removing supply from the immediate, liquid market, these holders are effectively tightening the "float"—the amount of ETH available for immediate sale.
Stablecoin Accumulation
While spot ETH is leaving exchanges, fresh capital is arriving in the form of stablecoins. Binance, in particular, has seen a 440% increase in stablecoin netflows compared to the 30-day average, totaling roughly $34.4 million in new inflows. This provides a clear picture: participants are parking "dry powder" on exchanges, waiting for the optimal entry point to deploy capital. When coupled with the 9% expansion in Open Interest (OI) observed over the quarter, it is evident that institutional players are building significant derivatives exposure alongside their spot accumulation.
The Institutional Perspective: Strategic Positioning
The current market environment is characterized by a "wait and see" approach, but it is not a lack of interest. Industry experts note that the current behavior—retail thinning out while large entities concentrate their holdings—is a classic precursor to volatility.

For institutions, the current price levels offer a historical value proposition. By accumulating at lower prices while the broader market is plagued by "apathy," these entities are positioning themselves to capture the upside when the next demand cycle begins. The institutional consensus suggests that while the macroeconomic environment remains challenging, the underlying network demand for Ethereum as a settlement layer for high-value transactions remains robust.
Implications for the Future: Is a Reversal Imminent?
The data suggests that the market is currently in a "coiled spring" phase. However, a structural setup, no matter how bullish in terms of on-chain metrics, requires a catalyst to translate into price appreciation.
The Bull Case
The bullish argument rests on the "scarcity" factor. If the current trend of net outflows continues, the available float of Ethereum will become increasingly thin. Should a positive fundamental catalyst arise—such as a shift in interest rate policy, a breakthrough in scaling, or renewed institutional FOMO—the combination of high stablecoin liquidity on exchanges and low spot supply could lead to a rapid, parabolic move to the upside. In this scenario, the participants currently accumulating at the $1,500–$1,600 range would be the primary beneficiaries.
The Bear Case
Conversely, the bear case remains tethered to the technical reality of the charts. As long as Ethereum fails to reclaim the $1,800 resistance, the trend remains structurally bearish. Any attempt at a rally could be met with aggressive resistance from those who were "trapped" during the breakdown from $1,900. If the $1,500 support fails to hold, the lack of historical demand levels below that point could lead to an accelerated decline into the $1,200 range.

Conclusion
The narrative that Ethereum is in a state of structural decay is not supported by the data. While the price chart paints a picture of weakness, the on-chain reality describes a process of institutional consolidation. Retail apathy has created a vacuum, and large-scale holders are systematically filling it by tightening the supply and positioning for the next phase of the cycle.
The path forward for Ethereum will likely be determined by which force prevails: the current technical momentum that favors the bears, or the underlying supply-demand imbalance being engineered by the whales. For now, the market remains a battleground of patience, where those who understand the shift in on-chain behavior are quietly preparing for a transition that the rest of the market may not see until it has already arrived. Investors should monitor the $1,500 support level closely, as its defense—or failure—will likely dictate the trend for the remainder of the year.