XRP Faces Unprecedented Technical Headwinds: Monthly RSI Hits All-Time Low Amid Market-Wide Contraction
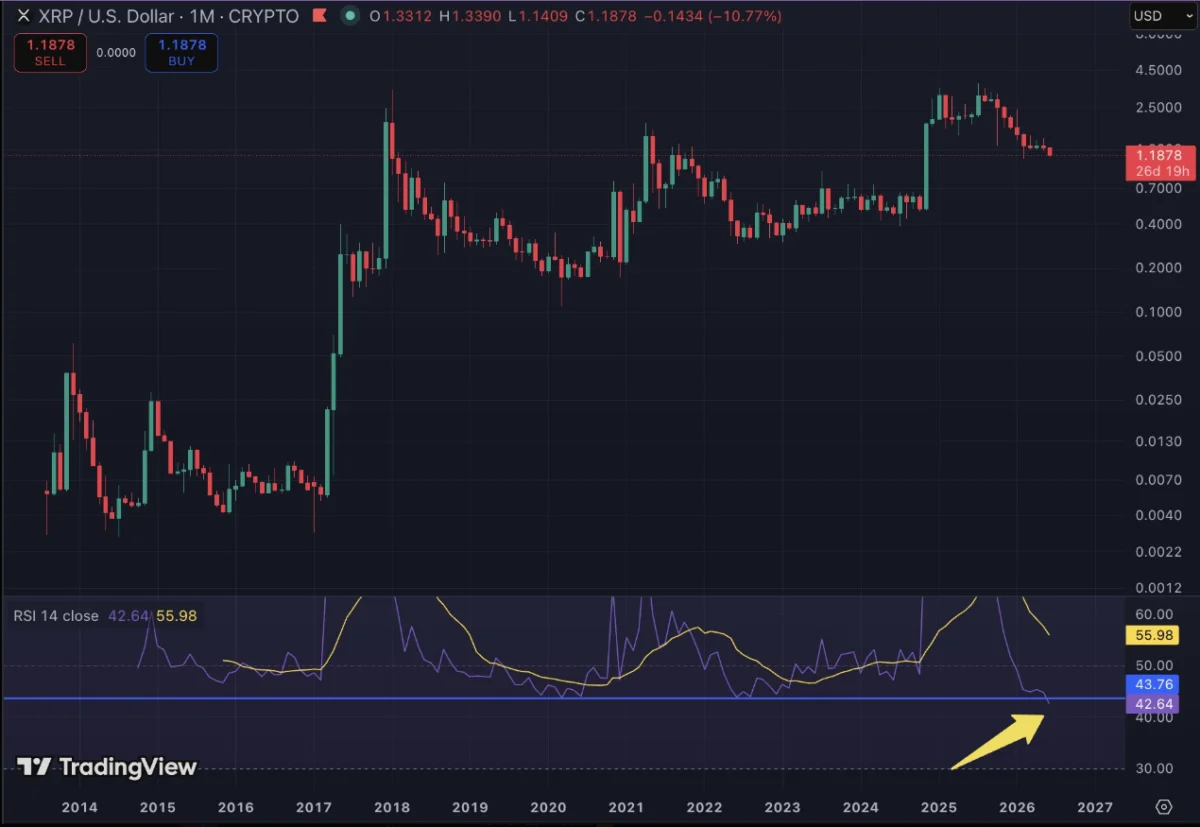
The digital asset landscape is currently grappling with a period of intense volatility, and few assets reflect the severity of this shift more acutely than XRP. Recent technical data has sent shockwaves through the XRP community, as the token’s monthly Relative Strength Index (RSI) has plummeted to 41.64. This figure marks the lowest reading in the asset’s history, eclipsing the previous floor of 43.75 set in March 2020—a period defined by one of the most punishing bear markets in cryptocurrency history when XRP traded as low as $0.11.
As traders and institutional analysts scramble to interpret this technical anomaly, the broader implications for the Ripple-associated token remain a subject of heated debate. While the data suggests an extreme level of exhaustion in selling pressure, the market is currently caught in a precarious waiting game, with June’s monthly candle yet to close.
A Signal With a Critical Caveat
To understand the weight of this technical indicator, one must first recognize that the RSI is a momentum oscillator that measures the speed and magnitude of recent price movements. Traditionally, a reading below 30 is categorized as "oversold," suggesting that an asset may be undervalued and due for a reversal. While XRP’s current reading of 41.64 has not yet breached the traditional "oversold" threshold, its significance lies in its relative historical context: the token has never been this technically "weak" on a monthly time frame.
However, market participants are advised to exercise caution. The June monthly candle remains open, and the current RSI reading is not yet finalized. Financial analysts point out that if XRP were to demonstrate a robust recovery—surpassing the $1.30 mark before the month concludes—the RSI would likely adjust upward, effectively neutralizing the current bearish signal.
The alert was first brought to the public consciousness by an prominent XRP market commentator known as "Austin." His initial analysis flagged a reading of 42.64 when the token was trading at $1.18. Since that initial alert, the price has slipped further to roughly $1.11, dragging the RSI down to its current record low. This prolonged decline represents a staggering 61% drawdown from the token’s October 2025 peak of $2.84, highlighting a period of stagnation that has left many long-term holders questioning the asset’s short-term viability.

Chronology of the Decline: From Peak to Pressure
The path to these current lows has been marked by a slow, agonizing erosion of value rather than a singular, sharp collapse. Following the October 2025 high, XRP entered a multi-month period of consolidation that ultimately resolved to the downside.
- October 2025: XRP reaches a significant cycle high of $2.84, buoyed by optimistic market sentiment and high trading volumes.
- November 2025 – Q1 2026: A period of persistent sell-side pressure begins, causing the asset to drift lower, breaking key support levels with limited resistance.
- February 2026: The price revisits levels not seen since the beginning of the year, signaling that the initial breakout momentum from the previous year had fully evaporated.
- June 2026 (Present): The token tests the $1.10 support level, coinciding with a broader market sell-off that saw XRP’s market capitalization shrink from $82.5 billion to roughly $69 billion in a single week—a 15% decline in total value.
This timeline underscores the lack of "meaningful recovery" mentioned by analysts. Unlike previous cycles, where rapid corrections were met with swift institutional buying, the current environment has been characterized by a lack of conviction, leaving the token vulnerable to macroeconomic headwinds.
Supporting Data: The Broader Market Contagion
XRP’s struggles do not exist in a vacuum. The entire cryptocurrency ecosystem has faced immense downward pressure throughout the first week of June. A primary catalyst for this week’s bearish sentiment was the confirmation that Strategy, an investment firm closely tied to Michael Saylor, divested 32 BTC from its massive holding of over 800,000 BTC.
While the sale of 32 BTC is statistically negligible in the context of the firm’s total holdings, the news acted as a psychological trigger for traders, leading to a broader market reaction. In the span of just seven days, the total cryptocurrency market capitalization shed approximately $330 billion. Bitcoin, the market leader, saw its price retreat toward the $63,000 support level, dragging altcoins—including XRP—down with it.
Furthermore, the divergence between the historical RSI data and current price action is striking. In March 2020, the RSI floor of 43.75 served as a definitive pivot point. Following that bottom, XRP engaged in a series of higher lows, culminating in a surge to $1.96 by April 2021. Even more impressively, the asset managed to reach $3.40 in November 2024, a 580% increase from the lows of that preceding year. The question currently facing investors is whether the 2026 RSI floor will act as a similar springboard or if it represents a structural shift in the token’s market lifecycle.
Official Responses and Market Sentiment
While there has been no official statement from Ripple Labs regarding the specific technical RSI reading, the atmosphere within the XRP community is a mix of defensive optimism and analytical concern. Commentators like Austin have utilized social media to highlight the "oversold" nature of the asset, framing the current drop as an anomaly that deviates from historical norms.
The general sentiment among professional traders on platforms like TradingView remains cautious. The consensus is that while the RSI suggests a technical rebound is mathematically probable, fundamental factors—such as regulatory developments, institutional adoption rates, and the broader macro environment—will ultimately dictate the price action. Market makers are currently watching the $1.00 psychological support level closely; a break below this figure could potentially trigger a new wave of liquidation, rendering the current RSI signals less relevant as the market enters "price discovery" to the downside.
Implications: What Comes Next?
The implications of this historic RSI reading are multifaceted. On one hand, it confirms that XRP is currently being traded at a level of intensity that is historically rare. For contrarian investors, this could be interpreted as a potential "buy signal," assuming the historical precedent of 2020 holds true. If the RSI acts as a reliable support indicator, the current price levels might be viewed as the "final shakeout" before a significant trend reversal.
However, the risk remains that the market landscape has fundamentally changed. The entry of new, more efficient assets and the shifting focus of institutional capital toward newer protocols could mean that XRP does not respond to technical indicators in the same way it did during the 2020/2021 cycles.
Key Considerations for Investors:
- The Monthly Close: All eyes are on the final day of June. A close above $1.30 would largely invalidate the "all-time low RSI" narrative, while a close near current levels would reinforce the bearish technical structure.
- Support/Resistance Levels: The $1.10 support is under heavy fire. If this fails, the next major support zone sits near the $0.90 to $0.95 range.
- Macro Correlations: As seen with the recent Strategy news, XRP remains highly sensitive to the movements of Bitcoin and the broader institutional perception of the crypto sector.
- Volume Analysis: A true reversal will require not just a bounce in RSI, but a sustained increase in buying volume to confirm that the bottom is in.
In conclusion, the record-low RSI for XRP is a signal that demands respect but warrants skepticism. While history suggests that extreme technical readings often precede trend reversals, the current market environment—plagued by institutional profit-taking and broader macroeconomic uncertainty—creates a landscape where historical patterns are not guaranteed to repeat. Investors are advised to monitor the monthly candle close with extreme vigilance, as it will serve as the primary arbiter of whether this signal is a precursor to a recovery or a warning of deeper, sustained volatility.