XRP Hits Unprecedented Territory: Monthly Relative Strength Index Plunges to All-Time Low Amid Brutal Market Correction
Cryptocurrency markets are facing severe downward pressure, and few major assets are feeling the pinch as acutely as XRP. According to recent technical data, XRP’s monthly Relative Strength Index (RSI) has collapsed to a historic low of 41.64, breaching thresholds previously untouched even during the darkest days of the 2020 bear market.
The staggering contraction comes as part of a broader macroeconomic and sector-wide liquidity drain that has erased hundreds of billions of dollars from the digital asset ecosystem in a matter of days. While technical analysts debate whether the current reading is a definitive bottom or a temporary misdirection, the steep correction has sent shockwaves through the XRP community, reigniting conversations about historical price floors, market cycles, and the psychological fortitude required to navigate extreme volatility.
Main Facts
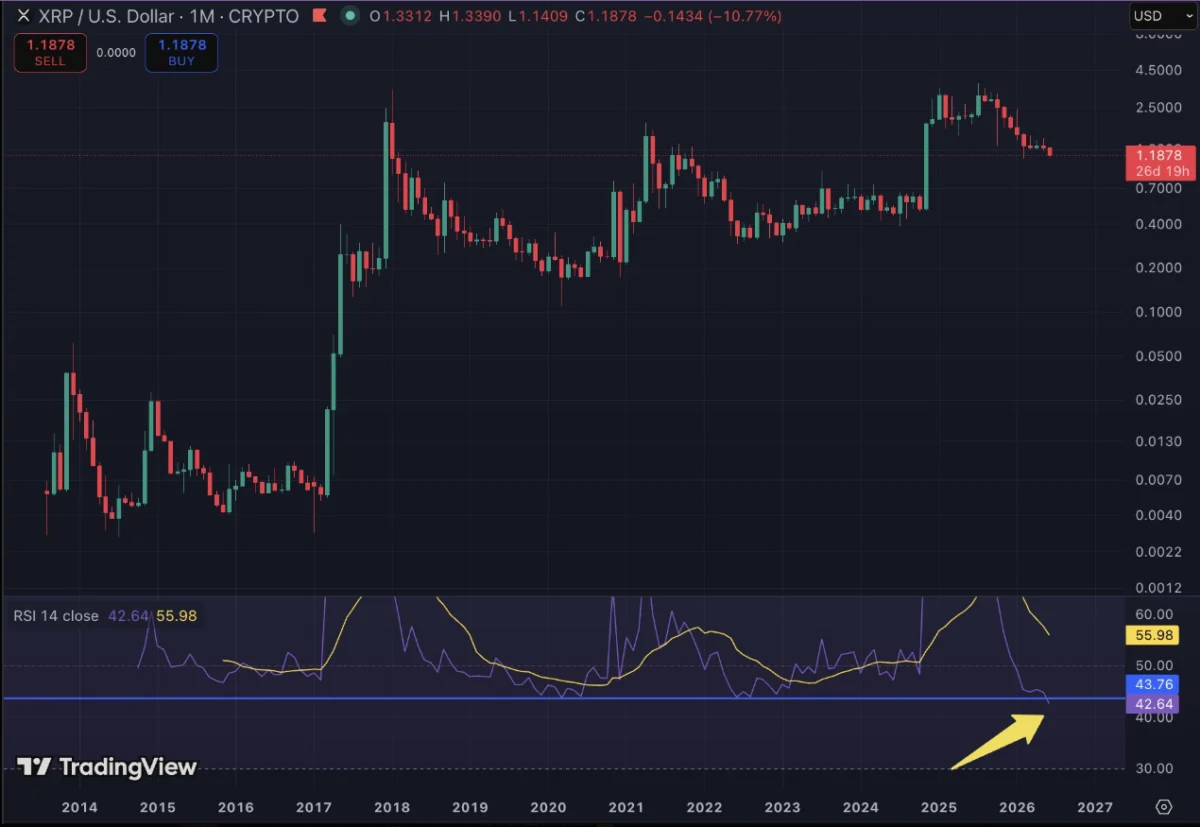
At the center of the current market discourse is a single, striking technical metric: XRP’s monthly Relative Strength Index. On-chain analyst and prominent XRP community commentator Austin was the first to publicly flag the anomaly, noting that the token’s monthly RSI had dipped to 42.64 as prices slid toward $1.18. Subsequent market weakness pushed the reading down further to 41.64 by the latest checks.
To contextualize this drop, the previous all-time low for XRP’s monthly RSI was recorded in March 2020 at 43.75—a period colloquially remembered as the COVID-19 liquidity crisis, during which global markets panicked and XRP bottomed out at a meager $0.11. The fact that the current monthly RSI reading has slipped beneath that historical floor has drawn immediate comparisons, though market structure and pricing tiers look vastly different today.
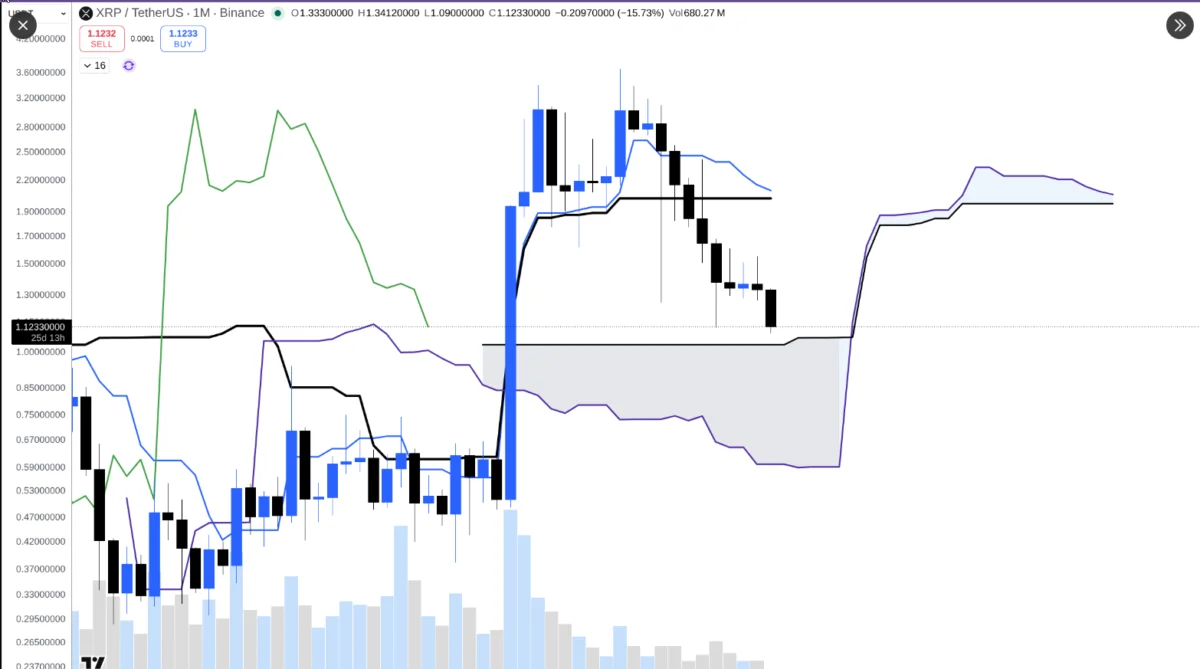
At the time of writing, XRP is exchanging hands at approximately $1.10 to $1.11. This price action places the asset roughly 61% below its multi-year high of $2.84, reached in October 2025. The prolonged, grinding nature of this downward slope—marked by months of lower highs and relentless selling pressure—has deprived holders of any meaningful intermediate relief rallies.
The wider market fallout has been equally punishing. The total cryptocurrency market capitalization shed a staggering $330 billion in the span of just seven days, driven by liquidations, macro headwinds, and unexpected institutional sell-offs. For XRP specifically, its market capitalization plunged from $82.5 billion at the beginning of the week to approximately $69 billion—a brutal 15% haircut in a matter of days that has dragged prices back down to levels last observed in early February.
Chronology
Understanding how XRP arrived at this historical technical juncture requires tracing the trajectory of both the broader market and the token’s performance over the past several years:

- March 2020 (The COVID-19 Crash): Amid a global financial panic, crypto markets experienced a historic flash crash. XRP plummeted to an cycle low of $0.11, registering a monthly RSI of 43.75—a reading that stood as the asset’s lowest structural momentum indicator for over six years.
- April 2021 – November 2024 (Cycle Recoveries): Following the 2020 low, XRP initiated a multi-stage recovery. Strong bullish momentum eventually pushed the token to $1.96 in April 2021. Later in the cycle, a powerful November 2024 surge drove prices as high as $3.40, marking an impressive 580% rally from the lows recorded just weeks prior.
- October 2025 (The Cycle Peak): XRP reached its most recent major peak at $2.84. Rather than consolidating at these higher ranges, the token initiated a prolonged, multi-month descending channel, characterized by a persistent lack of structural buying support.
- Early June 2026 (The Breaking Point): As macro conditions deteriorated and Bitcoin faced downward pressure, XRP slipped past the $1.20 and $1.15 support levels. On June 4, 2026, analyst Austin published data revealing an RSI reading of 42.64. As the week progressed, continued bleeding pushed the RSI to 41.64, officially breaking the March 2020 low.
Supporting Data
Technical analysis relies heavily on momentum oscillators to gauge market sentiment and asset valuation. The Relative Strength Index (RSI), developed by J. Welles Wilder, measures the speed and magnitude of recent price changes to evaluate whether an asset is overbought or oversold. Traditionally, an RSI reading below 30 is viewed as deeply oversold, while a reading above 70 indicates overbought conditions.
However, market analysts emphasize that timeframes matter immensely. While daily or hourly RSI readings swing wildly, a monthly RSI measures macro-level momentum over extended periods. For XRP to register a monthly RSI of 41.64, it indicates that the velocity and size of the recent downward price trajectory have completely eclipsed the multi-year average momentum, demonstrating an acute exhaustion of buyer demand on high timeframes.
Nevertheless, technical analysts have highlighted a crucial caveat regarding the current reading: June is not yet over.
Because the monthly candle remains open, the 41.64 figure is a dynamic, shifting metric rather than a finalized closing price. Market data indicates that if XRP can mount a substantial recovery—reclaiming price levels above $1.30 before the final stroke of June—the monthly RSI could close significantly higher. Such a recovery would largely neutralize the severity of the current signal, rendering the intraday low a mere statistical blip rather than a permanent macro inflection point.
Concurrently, the broader macroeconomic and sector data underscores the systemic nature of the current sell-off. Bitcoin drifted toward the $63,000 threshold following confirmation that Strategy (the corporate treasury firm closely tied to Michael Saylor) liquidated a modest 32 BTC from its massive holdings of over 800,000 BTC. While the absolute volume sold by Strategy was minuscule relative to its total stash, the psychological impact on a jittery market triggered cascading sell orders across altcoins, pulling down market leaders and hitting high-beta assets like XRP with disproportionate force.
Official Responses and Community Reactions
The crypto community—known for its intense speculative fervor and vocal technical analysts—has reacted to the RSI milestone with a mixture of anxious caution and historical optimism.
Austin, the market commentator who first brought the metric to mainstream attention via X (formerly Twitter), emphasized the unprecedented nature of the data. Sharing a chart mapping XRP’s multi-year momentum path, he noted: "XRP is the most oversold on the monthly time frame that it has EVER been."
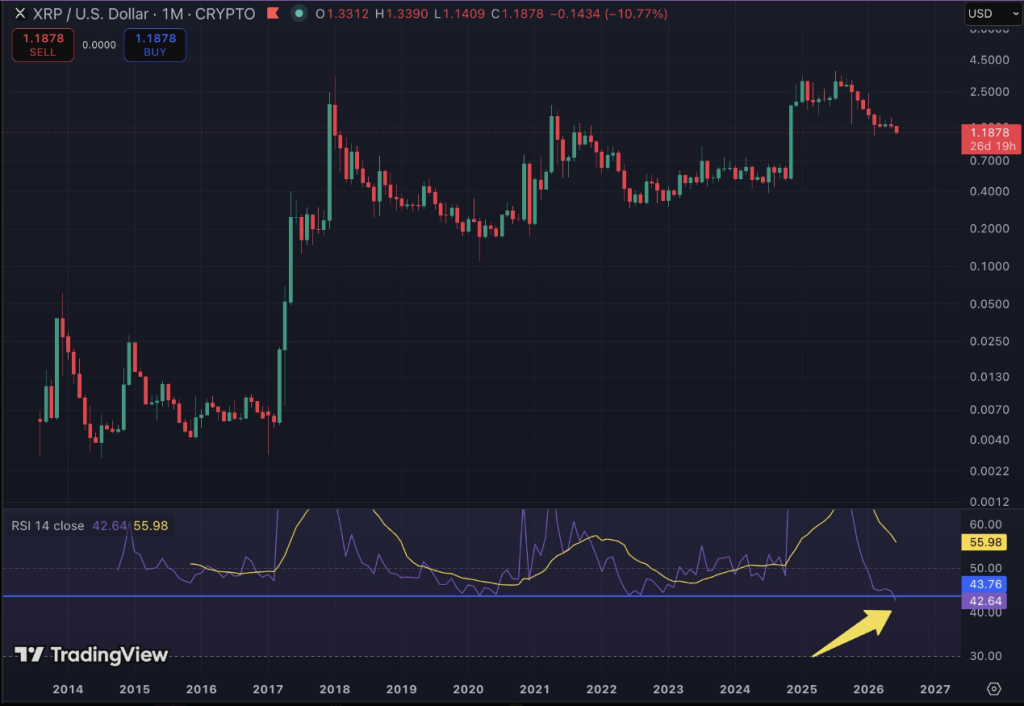
While influencer accounts and retail traders have largely oscillated between despair over the sub-$1.15 price action and hopeful anticipation of a rebound, institutional and professional analysts have adopted a more measured stance. Many trading desks have pointed out that historical analogies—such as comparing the June 2026 market environment directly to the March 2020 pandemic crash—overlook structural differences in liquidity, regulatory frameworks, and derivatives market open interest.
No official statements regarding the token’s market performance have been issued by Ripple Labs or executive leadership, as corporate entities typically refrain from commenting on short-term token price fluctuations or technical momentum indicators.
Implications
What does a record-low monthly RSI mean for the future path of XRP? Financial markets rarely move in straight lines, and extreme technical readings often serve as a double-edged sword for traders and investors alike.
1. The Contrarian Bull Case: Historical Accumulation
If history serves as any reliable guide, extreme oversold readings on high timeframes have historically coincided with generational buying opportunities. Following the March 2020 RSI low of 43.75, patient investors who accumulated XRP at deeply depressed valuations were rewarded with massive multi-hundred-percent expansions over the subsequent 12 to 24 months. Proponents of this view argue that extreme pessimism and exhausted selling pressure create the ideal vacuum for a macro trend reversal, suggesting that current prices near $1.10 may represent a deep-value zone for long-term portfolio builders.
2. The Bearish Reality: Structural Weakness and Risk of Further Losses
Conversely, skeptics warn against blindly catching a falling knife. An asset can remain oversold—or continue grinding downward—longer than leveraged traders can remain solvent. The fact that XRP has surrendered roughly 61% of its value since October 2025 without registering a single sustained impulse wave suggests that structural demand is severely lacking. If the broader cryptocurrency market fails to reclaim key macroeconomic supports, and Bitcoin continues its descent, historical RSI floors offer little physical protection against further downside.
3. The Importance of the June Close
Ultimately, the immediate fate of XRP’s technical narrative hinges on how the monthly candle closes. If buyers step in over the remainder of the month to push the token back above $1.30, the alarming 41.64 RSI reading will be categorized as a momentary wick—a brief spike in selling pressure that was aggressively absorbed by the market. However, if the candle closes near or below current levels, it will cement a new historical benchmark for downside momentum, locking in a technical precedent that market participants will study for years to come.
As June unfolds, all eyes remain glued to the charts. Whether this unprecedented monthly RSI reading marks the final capitulation phase of a brutal bear market or merely another stepping stone on a longer downward trajectory will soon be decided by the cold, hard mechanics of supply and demand.