Ethereum Navigates Market Stalemate: On-Chain Data Hints at Underlying Consolidation Amidst Retail Apathy
London, UK – [Date of Publication] – Ethereum, the second-largest cryptocurrency by market capitalization, finds itself in a precarious position, trading below the crucial $1,700 mark. The digital asset’s market has been characterized by a pervasive sense of apathy and uncertainty, leading to a directionless price action that has left participants on both sides of the trade increasingly frustrated. While Ethereum is neither staging a convincing recovery nor experiencing an aggressive sell-off, a deep dive into its network activity data, as analyzed by CryptoOnchain, suggests a narrative that directly challenges the notion of a market in structural decline. Instead, emerging patterns point towards a significant consolidation of capital by larger, more strategic holders, even as retail engagement wanes.
The Widening Gap: On-Chain Activity Divergence
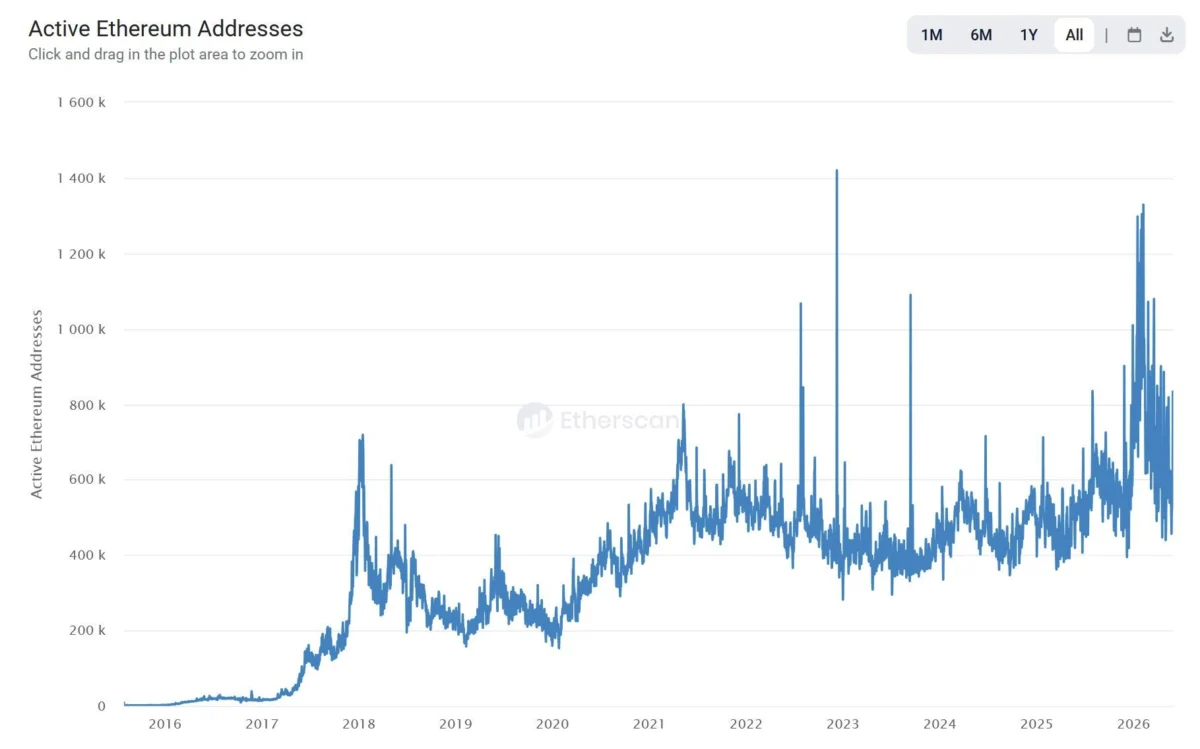
Over the past week, Ethereum’s on-chain transaction patterns have revealed a notable divergence, a development that offers a nuanced perspective on the current market sentiment. On the surface, daily transactions originating from regular user wallets have seen a substantial drop of approximately 43%. In isolation, this decline could be interpreted as a sign of waning network engagement and relevance during a challenging market period. However, this initial observation serves as the starting point for a more profound analysis.
Contrasting this reduction in transaction volume, the average value moved per transaction has experienced a dramatic surge of over 184%. Furthermore, the median transfer size has risen even more sharply. This juxtaposition—fewer transactions, but each carrying significantly greater value—paints a compelling picture. The data indicates that while the sheer number of routine interactions on the Ethereum network has decreased, the scale of the transactions that are occurring has dramatically amplified.
This specific combination of declining transaction counts and escalating transfer values is a well-recognized pattern in the study of on-chain behavior, particularly during periods of market stress. Historically, smaller, less committed participants tend to step back, reduce their activity, and await greater market clarity. Meanwhile, larger holders, often referred to as "whales," continue to operate, moving substantial amounts of capital in fewer, yet more significant transactions. These larger movements are indicative of deliberate strategic positioning rather than routine network usage.
The analysis by CryptoOnchain posits that this divergence is not a symptom of a fading network but rather a clear signal of capital consolidating into fewer, more substantial hands at current price levels. This implies that while the broader market may appear stagnant or indecisive, a significant underlying shift in ownership and strategic accumulation is taking place.
The Setup Is Consolidating: Whales Accumulate as Retail Retreats
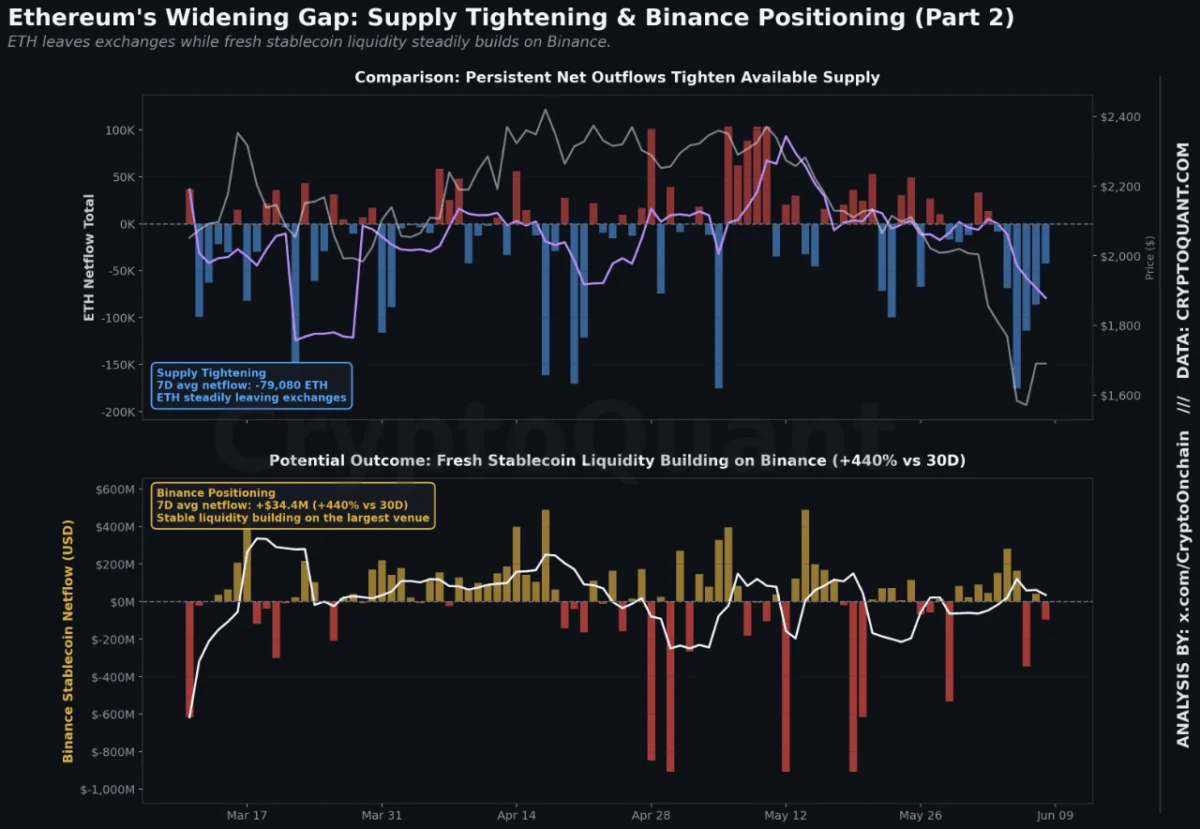
The CryptoOnchain analysis further strengthens its argument by connecting this transaction divergence to broader flow data, which corroborates the same behavioral pattern from multiple independent angles. Total ETH netflows, a key indicator of capital movement in and out of exchanges, remain deeply negative, standing at approximately -79,080 ETH. This substantial outflow signifies that large volumes of Ether continue to leave exchanges, rather than accumulating on platforms where they would be readily available for immediate sale. This consistent outflow indicates a real and ongoing contraction of readily available spot supply.

Simultaneously, fresh capital is actively positioning itself on Binance, a major cryptocurrency exchange, through the stablecoin channel. Stablecoin netflows into Binance have turned strongly positive, registering an increase of +$34.4 million. This represents a significant 440% surge compared to the 30-day average, highlighting an influx of purchasing power arriving on the exchange at the same time that spot ETH is being withdrawn.
Further evidence of this strategic accumulation comes from the Open Interest on Binance, which has expanded by approximately 9% over the quarter. This expansion in Open Interest confirms that larger participants are not only accumulating spot ETH but are also quietly building their derivatives exposure. This dual strategy—accumulating the underlying asset while increasing derivative positions—suggests a sophisticated approach to positioning for future market movements.
The combination of these observed trends—declining retail transaction counts, increasing average transaction values, consistent net outflows of ETH from exchanges, and robust inflows of stablecoins into major trading platforms—paints a clear picture of a market structure undergoing a significant transformation. Available float is tightening from the supply side due to withdrawals and consolidation, while potential demand is accumulating on the buy side through stablecoin inflows and derivatives positioning.
It is crucial to frame this analysis honestly. This particular combination of market conditions does not guarantee an immediate reversal. Structural setups, while indicative of potential, often require specific catalysts to trigger significant price action. However, what this analysis does describe is a specific pre-condition that has historically preceded more pronounced market moves once demand returns. It outlines a scenario where a tightening float meets concentrated buying power in an environment where the participants who remained active during the period of apathy are strategically positioned to benefit disproportionately when market sentiment inevitably shifts.
Ethereum Tests New Lows as Market Searches for a Bottom
While the on-chain data suggests underlying strength among sophisticated investors, the immediate price action for Ethereum remains under bearish control on the daily timeframe. The cryptocurrency has been trading near $1,630, having suffered a sharp breakdown from a multi-month consolidation phase that characterized trading between February and May.
The most significant technical development observed on the chart is the decisive loss of the $1,800-$1,900 support zone. This area had repeatedly acted as a significant demand floor throughout the first half of the year. Once this critical support failed, selling pressure accelerated rapidly, pushing ETH to fresh lows for 2026, hovering near the $1,500 mark.

From a market structure perspective, the sequence of highs and lows remains unequivocally bearish. The recovery attempt observed in April-May peaked near $2,400, forming a lower high relative to previous rallies, before sellers regained control. Since then, Ethereum has consistently produced a series of lower highs and lower lows, culminating in the recent collapse through established support levels. Importantly, the current price is trading well below the 50-, 100-, and 200-day moving averages, a confluence of indicators that confirms weakness across all major timeframes.
Volume behavior further underscores the recent sell-off. The latest price decline was accompanied by one of the largest volume spikes seen in months, signaling aggressive participation as ETH breached crucial support levels. While a short-term bounce did emerge from the $1,500 area, buyers have thus far struggled to reclaim any meaningful resistance.
The immediate battleground for Ethereum’s price action now lies within the $1,500-$1,550 region, which represents the most critical support level of the year. A sustained hold at this level could allow Ethereum to build a base after experiencing a decline of nearly 35% from its May highs. However, unless the price can decisively reclaim the former support zone around $1,800, any rallies are likely to be interpreted as corrective moves within a broader downtrend, rather than the commencement of a durable recovery.
Expert Analysis and Market Implications
The divergence between the bearish price action and the bullish on-chain accumulation patterns presents a complex scenario for market observers. While the technical charts indicate weakness, the underlying on-chain metrics suggest that significant market players are using the current price weakness as an opportunity to accumulate.
Chronology of Events:
- February – May: Ethereum consolidates within a defined range, with the $1,800-$1,900 zone acting as a consistent support level.
- May: A recovery attempt peaks near $2,400, forming a lower high, signaling a potential shift in momentum.
- Late May – Present: Ethereum experiences a sharp breakdown from its consolidation, losing key support levels and trading near multi-year lows.
- Past Week: On-chain data reveals a significant drop in regular user transactions (-43%) but a substantial increase in the average value per transaction (+184%) and median transfer size.
- Concurrent On-Chain Data: Net ETH outflows from exchanges remain negative (-79,080 ETH), while stablecoin inflows into Binance surge (+440%). Open Interest on Binance increases by approximately 9%.
Supporting Data and Analysis:

The core of the bullish on-chain argument rests on the interpretation of transactional data. A decline in the number of transactions coupled with an increase in their average value is a classic indicator of "whales" or large holders taking advantage of lower prices to accumulate. They are moving larger sums of capital in fewer transactions, a strategy often employed during periods of low retail participation and market uncertainty.
The consistent net outflows of ETH from exchanges further support this narrative. When ETH leaves exchanges, it typically indicates that holders are moving their assets to private wallets for long-term holding (HODLing) or staking, rather than for immediate sale. This reduces the readily available supply on the market, potentially amplifying price increases when demand returns.
The surge in stablecoin inflows to exchanges like Binance is also a critical piece of the puzzle. Stablecoins are often used as a vehicle to purchase other cryptocurrencies. A significant increase in stablecoin deposits suggests that capital is readily available and waiting to be deployed into assets like Ethereum once market conditions become more favorable.
Official Responses and Market Commentary:
As of the latest reporting, there have been no official statements from the Ethereum Foundation or major development teams addressing the specific on-chain divergence observed by CryptoOnchain. However, the analysis itself, published by CryptoOnchain, serves as a form of commentary on the current market state, offering an alternative perspective to the purely price-driven bearish sentiment. Industry analysts are closely monitoring these on-chain metrics, with many acknowledging the potential for a significant shift in market dynamics if these accumulation patterns persist.
Implications for the Future:

The current market situation presents a dichotomy. On one hand, technical indicators and price action point towards continued downside pressure. On the other hand, on-chain data suggests a strong undercurrent of accumulation by sophisticated investors.
- Potential for a Sharp Recovery: If the observed consolidation by large holders continues and a catalyst emerges (such as positive regulatory news, broader market recovery, or significant network upgrades), Ethereum could experience a rapid and substantial price increase. The limited available supply and accumulating buying power create a scenario ripe for a swift upward movement.
- Sustained Bear Market: Conversely, if the bearish technicals continue to dominate and no catalyst materializes, Ethereum could remain in a prolonged period of stagnation or further decline. In this scenario, the accumulating capital may simply wait for even lower prices, or the broader market sentiment could overwhelm the accumulation efforts.
- Shift in Retail Sentiment: The current apathy among retail investors is a significant factor. A sustained recovery in price, driven by institutional accumulation, could eventually reignite retail interest, further fueling the upward momentum. However, without a clear upward trend, retail investors may remain on the sidelines.
The current market for Ethereum is a testament to the complex interplay of technical analysis, on-chain metrics, and broader market sentiment. While price action may paint a grim picture, the hidden activity within the network suggests that powerful forces are at play, potentially positioning Ethereum for a significant move once the current period of uncertainty subsides. Investors and traders are advised to closely watch both price action and the evolving on-chain data to navigate this dynamic market landscape.