XRP on the Verge: Analysts Identify Potential for Massive Parabolic Breakout
The cryptocurrency market is currently witnessing a period of intense speculation regarding Ripple’s native token, XRP. While the broader digital asset landscape navigates macroeconomic uncertainties, a cohort of technical analysts has identified what they describe as a "hidden" bullish formation that could catalyze a historic surge for the asset. By analyzing historical fractals and current chart structures, experts suggest that XRP is not merely idling; it is coiling for a potential move that could rewrite its price trajectory for the remainder of the cycle.
The Technical Setup: History Repeating Itself
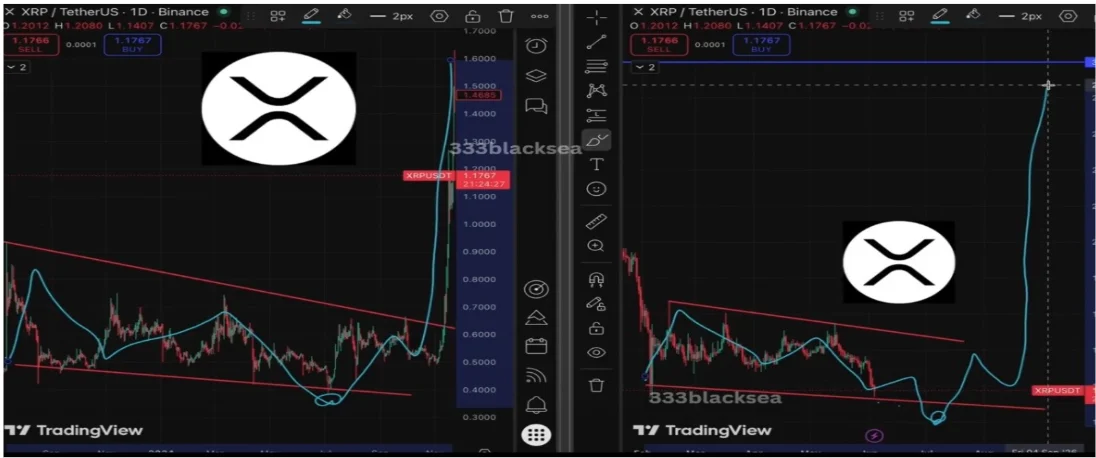
At the center of this discourse is an analyst known as "Blacksea," who recently highlighted a compelling correlation between current price action and the patterns observed in 2024. According to Blacksea, XRP has printed a classic "falling wedge" pattern—a technical formation often associated with trend reversals and subsequent explosive upward momentum.
The 2024 precedent serves as the primary pillar for this hypothesis. During that period, XRP was mired in a phase of consolidation, trading around the $0.50 level. As the falling wedge matured, the asset experienced significant volatility, characterized by sharp fluctuations and compression between converging trendlines. Crucially, the pattern concluded with a "false breakdown"—a scenario where the price dipped below the lower support boundary, effectively shaking out weak hands before initiating an aggressive recovery. That specific reversal triggered a 600% rally, propelling XRP past the $1.50 threshold.
Current observations suggest a hauntingly similar trajectory. XRP is presently oscillating within a narrowing range, reflecting a period of intense accumulation and compression. While the asset has yet to break the lower boundary of its current wedge, Blacksea posits that even a temporary breakdown—a "final shakeout"—could be the necessary precursor to a massive, parabolic reversal.

Chronology of the Current Market Sentiment
To understand the weight of these predictions, one must look at the progression of market sentiment over the past few weeks:
- Early June 2024: The market witnessed a renewed focus on XRP’s long-term technical health as it struggled to maintain momentum above the $1.00 psychological level.
- Mid-June 2024: Analyst Blacksea formally identified the falling wedge, comparing it to the structural foundations of the previous year’s 600% rally. This drew immediate attention from the crypto trading community, which has been searching for signs of a breakout from the asset’s prolonged downtrend.
- Late June 2024: Independent analyst Celal Kucuker introduced a secondary layer of analysis, focusing on a "Cup & Handle" formation. This added a macro-perspective to the discussion, suggesting that while short-term volatility remains a threat, the long-term potential targets are significantly higher than previously anticipated.
This chronology illustrates a shift from skepticism to cautious optimism. As the price hovers around the $1.07 mark, traders are balancing the fear of a retest of lower support levels against the high-reward potential of a confirmed technical breakout.
Supporting Data: The Cup & Handle and Fibonacci Projections
While Blacksea focuses on the falling wedge, analyst Celal Kucuker has provided a broader outlook via a Cup & Handle pattern, a bullish continuation structure. In his technical assessment, Kucuker provides a roadmap that accounts for both the risks of a correction and the potential for astronomical gains.
The Correction Phase
Kucuker’s model acknowledges that the path to a new all-time high is rarely a straight line. He warns that before a major breakout, XRP may face an "extended downward trend," with a potential correction toward the $0.90 zone. This level is critical; should it fail to hold, the bullish structure could be invalidated, potentially leading to a deeper retracement toward the $0.48 support level.
The Path to $14
Should the $0.95 support level hold, however, Kucuker’s analysis projects a series of milestones. The first target is a return to $1.50. Upon clearing this resistance, the model forecasts a surge to $3.66—a 282% increase from the support base. The most ambitious aspect of this projection is the use of the 1.618 Fibonacci Extension, which places a potential price target at $14.10. Reaching this milestone would represent a 1,378% rally from the $0.95 support area, a move that would fundamentally alter the market capitalization of the token.
Institutional and Official Responses: The Ripple Context
It is important to note that these technical analyses operate independently of Ripple’s corporate developments. While technical analysts focus on price action and order book dynamics, the broader XRP ecosystem remains heavily influenced by regulatory clarity and institutional adoption.
Ripple has maintained a consistent narrative of expansion, focusing on cross-border payment solutions and the integration of the XRP Ledger (XRPL) into traditional financial frameworks. While company officials generally avoid commenting on specific price predictions, they frequently emphasize the utility of XRP as a bridge currency. The disconnect between "retail-driven" technical analysis and the "utility-driven" focus of Ripple serves as a reminder that while charts provide a map, the "fuel" for such a rally often requires fundamental catalysts, such as increased institutional volume or favorable regulatory developments in key markets.
Implications for Investors and Market Participants
The convergence of multiple technical patterns—the falling wedge and the Cup & Handle—suggests that XRP is currently in a "make or break" phase. For the retail investor, the implications are twofold:
- Risk Management is Paramount: Both analysts emphasize that these patterns are not guarantees. The mention of "false breakdowns" and "final shakeouts" implies that the market may deliberately induce fear to clear out leveraged positions before a sustained move. Investors are urged to use stop-loss orders and avoid over-leveraging, as volatility in this phase can be extreme.
- Early Positioning vs. Validation: There is a classic debate in trading circles regarding whether to "buy the dip" (anticipating the reversal) or "buy the breakout" (waiting for the trend to be confirmed). The current setup invites both strategies. Those with a higher risk tolerance are looking for entries near the $0.90–$0.95 support levels, while more conservative traders may wait for a decisive move above the $1.50 resistance.
Final Thoughts: The Road Ahead
The potential for an XRP breakout is supported by a confluence of historical data and widely respected technical patterns. If the "falling wedge" triggers a repeat of the 2024 performance, or if the "Cup & Handle" facilitates a run toward the $14 level, the implications for the broader altcoin market would be profound.
However, the cryptocurrency market is notoriously unpredictable. External factors, including Bitcoin’s dominance and shifting interest rate policies, will play a role in whether these technical targets are met. For now, the charts suggest that XRP is under-accumulated and structurally poised for a significant move. Whether this move results in a "final shakeout" or the start of a historic bull run remains the primary question for investors watching the charts this month. As always, market participants should remain vigilant, conduct their own due diligence, and remember that technical analysis is a tool for probability, not a crystal ball for certainty.