Bitcoin Plunges Below Production Costs: Miner Stress Ignites Fresh Bear-vs-Bull Market Debate
June 20, 2026
By the News Desk | Edited by Samuel Rae
Main Facts
The cryptocurrency market has entered another phase of intense technical and macroeconomic scrutiny as Bitcoin (BTC) fluctuates near the low-$60,000 threshold. Recent market data and commentary shared across social and charting platforms highlight a recurring yet critical on-chain phenomenon: Bitcoin is once again trading below its estimated average cost of production.
This development has brought the issue of miner capitulation and profitability back to the forefront of industry discussions. According to on-chain analysts and market observers, trading below production costs historically correlates with extreme operational stress for Bitcoin miners. However, market technicians note that this metric has traditionally acted as a lagging indicator of a late-stage bear market cycle rather than the trigger for a new structural downturn.
Concurrently, technical analysts point to a critical demand and liquidity zone between $60,000 and $62,000. While the threat of miner liquidations looms large over the broader crypto economy, bulls are aggressively defending this multi-month support floor. Whether this region acts as a springboard for a macro-level trend reversal or caves under systemic sell pressure remains the defining question for institutional and retail portfolios alike.
Chronology: How the Current Market Structure Unfolded
To understand Bitcoin’s current predicament near the $60,000 baseline, it is vital to trace the historical and recent timeline of events leading up to this inflection point.
The Post-Halving Reality (Late 2024 – 2025)
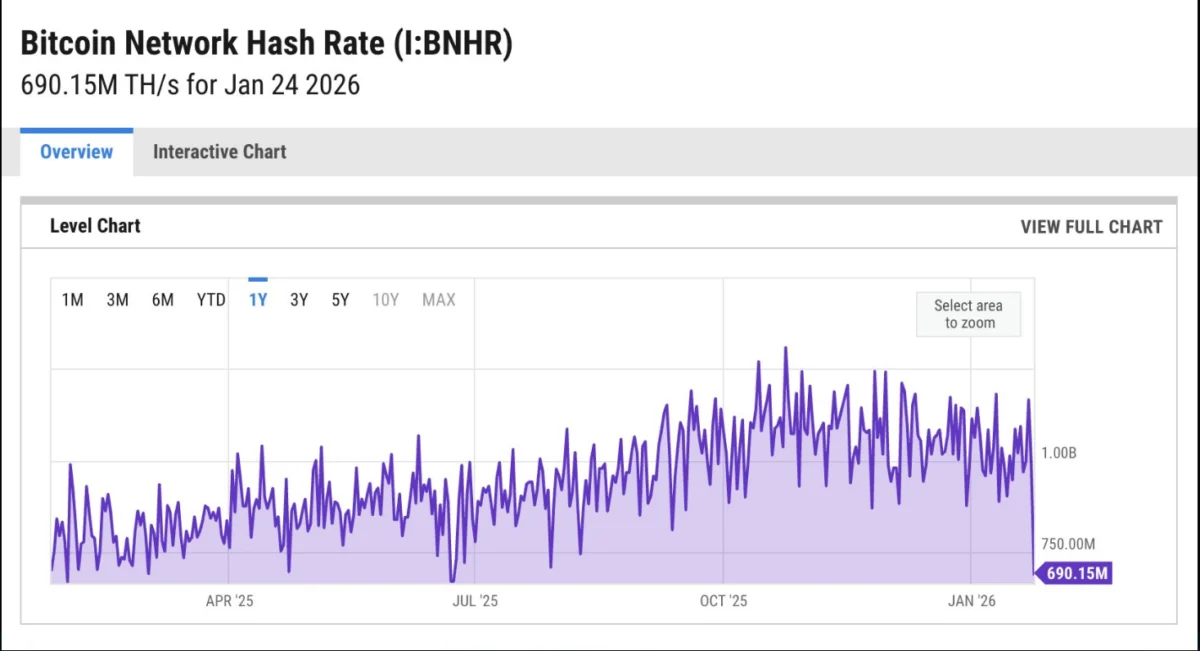
Following the major network block subsidy halving, Bitcoin mining economics underwent a structural transformation. With block rewards cut in half, hash rate efficiency became the ultimate determinant of survival. Throughout late 2024 and 2025, mining pools experienced fluctuating profit margins. As network difficulty climbed to unprecedented all-time highs, smaller and less efficient mining operations found themselves squeezed by rising electricity costs and thinning block rewards.
The Recent Correction and Liquidity Sweep (Early June 2026)
As the broader digital asset market entered a corrective phase from its previous highs, Bitcoin experienced a sharp downward impulse. During this leg down, price action swept through several structural lows, triggering cascading liquidations across leveraged derivatives markets. According to TradingView market commentary, this downward flush successfully harvested underlying liquidity, driving BTC straight into a heavily defended multi-week demand zone stretching from $60,000 to $62,000.
The June 20 Inflection Point
On June 20, 2026, crypto analyst shabr.eth posted an evaluation on X (formerly Twitter) highlighting that Bitcoin was officially trading below its estimated average cost of production once again. This renewed focus on production costs coincided precisely with the asset’s test of the $60,000 support floor. The convergence of macro miner stress metrics and critical technical support set off a widespread debate across the crypto community regarding whether the market is experiencing the final flush of a cycle or bracing for a deeper macro bear market.
Supporting Data: Production Costs, Miner Stress, and Technicals
Evaluating Bitcoin’s current market health requires a close look at both on-chain mining economics and technical price structures.
1. The Cost of Production Dilemma
Calculating Bitcoin’s exact average cost of production is an inherently complex task. It fluctuates based on several dynamic inputs:
- Hardware Efficiency: The operational ratio of Terahashes per joule (TH/J) delivered by modern ASIC rigs (such as the Antminer S21 or Bitmain equivalents) versus older generation hardware.
- Energy Tariffs: The average cost of electricity per kilowatt-hour (kWh) paid by mining operations globally, which varies significantly across jurisdictions like North America, Scandinavia, Central Asia, and Latin America.
- Network Hash Rate: The total computational power securing the network, which directly influences mining difficulty adjustments.
When market price dips below the aggregate cost of production, inefficient miners operate at a net cash-flow negative. Historically, this dynamic pressures mining companies to liquidate accumulated BTC treasuries to cover fixed overhead expenses like hosting, equipment financing, and power bills.
2. Historical Precedent: Late-Stage Bear vs. Early Bear
A common misconception among retail market participants is that trading below production cost signals the immediate initiation of a catastrophic bear market. However, historical cycle analysis reveals a different narrative. In past market cycles, sustained periods of miners operating below production cost have frequently materialized near cycle bottoms or late-stage bear market consolidations rather than at the onset of major downtrends.
When weak hands and inefficient operators are systematically purged from the network, hash rate drops, difficulty adjusts downward, and the market builds a durable supply floor.

3. Technical Support and Liquidity Zones
From a charting perspective, the interaction between price and technical indicators reveals a delicate balance of power:
- The $60,000–$62,000 Demand Pocket: Technical analyses shared via TradingView (specifically inputs from Smart_money_Fx) indicate that this zone represents a major historical reaction area.
- Liquidity Sweeps: The recent sweep of weak lows suggests that stop-losses and resting buy/sell orders below key psychological thresholds have been cleared out, reducing immediate order book friction.
Official Responses and Market Commentary
The interplay between miner health and technical price action has prompted widespread commentary from analysts, on-chain researchers, and institutional observers.
In his widely circulated June 20 commentary, shabr.eth emphasized the historical significance of the production-cost metric:
"#Bitcoin is trading below its average cost of production again. Historically, this has usually pointed to miner stress and the late stage of a bear market for #crypto, not the beginning of one. So, bear or bull?"
Adding to the technical discourse, market analysts on TradingView evaluated the resilience of current price floors. Smart_money_Fx noted that the impulsive correction from recent local highs successfully tested structural support, observing that:
"BTCUSD has reached a major support zone after a sharp correction. The recent sweep of a weak low suggests liquidity has been taken, while price is still respecting a critical demand area around $60,000 to $62,000."
While institutional mining firms have increasingly diversified their balance sheets—often leveraging AI infrastructure, high-performance computing (HPC) hosting, and equity financing to cushion against market volatility—smaller, private operations remain highly vulnerable to prolonged spot price depressions.
Implications for the Broader Crypto Ecosystem
The convergence of Bitcoin trading below production costs while sitting atop a major technical support zone carries several profound implications for investors, miners, and the broader digital asset economy.
For Short-Term Traders
For short-term market participants, the current environment is a high-stakes battleground. The $60,000–$62,000 region acts as the ultimate line in the sand. If bulls successfully defend this zone and establish a higher low, it could trigger a sharp relief rally driven by short covering and liquidations of over-leveraged short positions. Conversely, a decisive breakdown below $60,000 would likely accelerate forced liquidations, putting immediate downward pressure on altcoins and broader crypto market capitalization.
For Bitcoin Miners
For the mining sector, this period tests operational resilience. Companies with access to cheap, locked-in power contracts and modern, energy-efficient ASIC fleets are well-positioned to weather the storm. However, undercapitalized miners face difficult choices:
- Selling native BTC treasury holdings, thereby increasing immediate sell pressure on open exchanges.
- Unplugging unprofitable rigs, leading to a temporary contraction in network hash rate.
- Seeking emergency capital restructuring or exploring pivot opportunities toward AI and cloud computing data centers.
For Long-Term Investors (HODLers)
Historically, phases marked by miner capitulation and heavy on-chain stress have offered some of the best long-term accumulation windows for patient capital. While the short-term sentiment remains fraught with anxiety, macroeconomic cycles suggest that periods of intense miner pain often precede structural supply absorption.
What Confirms Strength?
Market analysts universally agree that stopping the downward momentum is insufficient to declare a definitive bullish reversal. To confirm true underlying strength and invalidate the threat of extended miner capitulation, Bitcoin must achieve specific technical milestones:
- Reclamation of Local Resistance: Breaking back above immediate overhead moving averages and resistance levels.
- Market-Structure Shift: Printing higher highs and higher lows on higher timeframe charts (such as the 4-hour and Daily timeframes).
- Demand-Driven Volume: Demonstrating that upward price movement is fueled by genuine organic spot demand and order book absorption, rather than temporary short-covering bounces.
Until these criteria are met, the production-cost debate remains an invaluable warning signal—a reminder of the underlying economic friction beneath the network, and a test of whether current support levels can absorb the stress or give way to a deeper correction.