XRP Quietly Forms Identical 2024 Bullish Setup: Analysts Project Massive Parabolic Surge Following Potential Shakeout
The cryptocurrency market is largely overlooking a massive technical formation developing on the XRP chart, according to prominent crypto analysts. Historical parallels suggest that a familiar bullish pattern could trigger a parabolic triple-digit rally, though experts warn investors must first navigate a volatile downside correction and potential market shakeout.
Main Facts
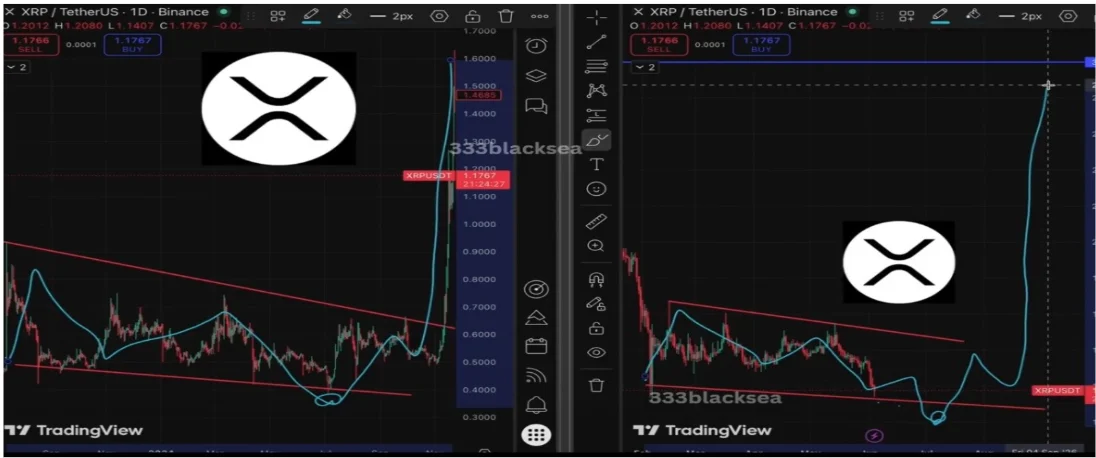
- The Bullish Technical Setup: Crypto analyst Blacksea has identified that XRP has replicated the exact falling wedge price pattern it formed during 2024, a setup that previously preceded a massive 600% upside move.
- Current Market Standing: Trading at approximately $1.07, XRP is experiencing continued price compression within the wedge boundaries, signaling that a decisive breakout or breakdown is imminent.
- The "Final Shakeout" Scenario: Analysts note that a brief breakdown below the pattern’s lower trendline could mimic the false breakdown seen in 2024, serving as a classic market flush before a sharp bullish reversal.
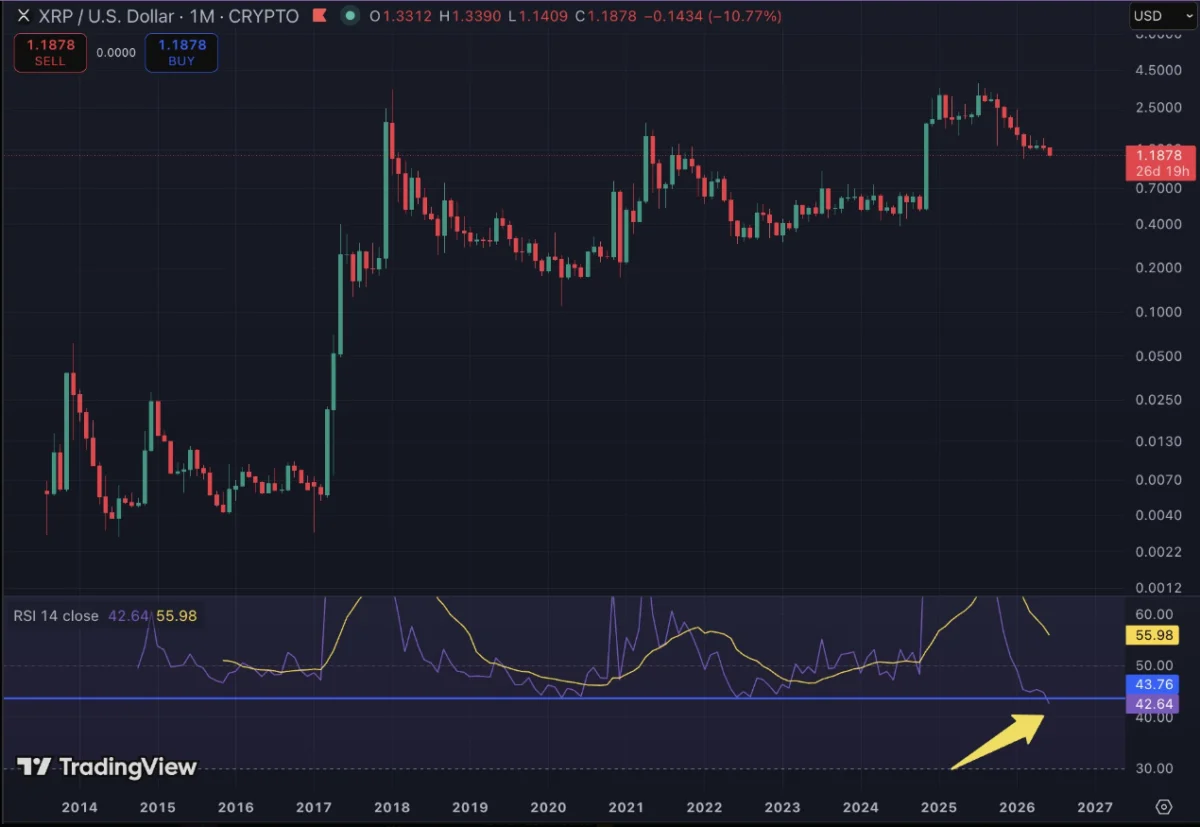
- Long-Term Ambitious Targets: In a separate analysis, market expert Celal Kucuker highlighted a developing macro Cup and Handle pattern pointing toward a potential rally to the 1.618 Fibonacci Extension level near $14.1, representing a staggering 1,378% surge from key support.
- Immediate Downside Risks: Before any explosive upward movement occurs, analysts warn that XRP could extend its current downtrend, dropping toward crucial support regions between $0.90 and $0.95, or risk a deeper correction down to $0.48 if structural supports fail.
Chronology: The Evolution of XRP’s Technical Structure
The 2024 Blueprint
To understand the significance of XRP’s current market behavior, analysts are looking back to the price action of 2024. During that period, XRP was consolidating tightly around the $0.50 mark, locked inside a narrowing falling wedge pattern characterized by lower highs and lower lows.
As price compression intensified, the asset briefly dipped below the lower boundary of the wedge. While this breakdown triggered panic among retail investors and forced leveraged long positions out of the market—marking a textbook "false breakdown"—it ultimately created the liquidity needed for a massive trend reversal. Momentum shifted aggressively, driving XRP past the $1.50 threshold and delivering a historic 600% rally that caught the broader altcoin market by surprise.
The Present Setup (Mid-2026)
Fast forward to the current market cycle, and the chart structure has begun to mirror its 2024 predecessor almost identically. On June 6, crypto analyst Blacksea drew public attention to the formation, noting that the broader market has largely failed to notice the developing pattern.
XRP has once again entered a period of steady price compression and repeated downward swings. While the token has not yet broken through the lower trendline of the wedge, analysts are actively monitoring the price action for signs of a repeat performance. If the pattern holds true, the current market consolidation is merely the precursor to a high-volatility breakout sequence.

Supporting Data and Technical Analysis
The technical outlook for XRP is underpinned by multi-timeframe chart patterns and key Fibonacci extension levels. Two distinct analytical perspectives outline the path ahead for the digital asset.
Blacksea’s Falling Wedge and Volatility Outlook
Blacksea’s analysis centers heavily on the behavior of the falling wedge. As the price action coils tighter between the upper and lower resistance and support lines, volatility is expected to contract before an explosive expansion.
- Current Price: ~$1.07 (as recorded on TradingView charts).
- Historical Precedent: The 2024 wedge yielded a 600% upside surge from a $0.50 base.
- Projected Move: A successful replication of the setup would completely invalidate the ongoing macro downtrend, shifting XRP into a renewed, aggressive bullish phase.
However, Blacksea has emphasized strict risk management. If the pattern fails to function as a bullish reversal structure, traders could face extended downside volatility. Consequently, early positioning paired with tight stop-losses is being recommended by technical strategists for those looking to capitalize on the setup.
Celal Kucuker’s Macro Cup and Handle Projection
Adding weight to the bullish narrative, analyst Celal Kucuker published a broader macro perspective highlighting a massive Cup and Handle pattern forming on higher timeframes.
According to Kucuker’s roadmap, the journey to higher prices will not be entirely linear:
- Near-Term Correction: XRP is expected to extend its current correction phase, with immediate downside targets resting near the $0.90 to $0.95 support zone.
- Initial Rebound Targets: Should bulls successfully defend the $0.95 level, an initial recovery rally is projected toward $1.50, closely followed by a secondary surge to $3.66 (representing an approximate 282% gain from support).
- Macro Extension: The ultimate target sits near the 1.618 Fibonacci Extension level at $14.10. Reaching this milestone would equate to an extraordinary 1,378% increase from the $0.95 support area.
Conversely, Kucuker’s charts caution that a failure to hold the $0.95 floor could invalidate the near-term bullish structure, potentially opening the door for a deeper retracement toward the $0.48 region.
Market Implications and Risk Management
The identification of these overlapping bullish structures carries significant implications for institutional investors, retail traders, and portfolio managers holding or looking to accumulate XRP.
Psychological Warfare and Market Shakeouts
Crypto market cycles are notoriously cyclical, often punishing impatient market participants just before major trend shifts. The prospect of a "final shakeout"—as predicted by both Blacksea and Kucuker—highlights the psychological stress inherent in trading digital assets.
If XRP dips toward $0.90 or briefly breaks its wedge support, weak hands are likely to capitulate, selling their holdings at a local bottom. Institutional accumulation historically accelerates during these exact moments of maximum pessimism, absorbing retail sell pressure and laying the groundwork for parabolic rallies.
Portfolio Positioning Strategies
Given the binary nature of technical breakouts, financial analysts and risk management experts recommend several tactical considerations for market participants:
- Staggered Accumulation (DCA): Rather than entering a full position at current prices ($1.07), investors are utilizing Dollar-Cost Averaging (DCA) to buy incremental amounts during anticipated dips toward the $0.90–$0.95 range.
- Invalidation Levels: Establishing clear stop-loss parameters below critical structural supports (such as a drop toward the $0.48 zone) protects capital against systemic altcoin downturns.
- Long-Term Horizon: For traders targeting the ambitious $14+ Fibonacci extension levels, patience through intermediate volatility and price corrections is viewed as a prerequisite for capturing macro gains.
Conclusion
As XRP trades near $1.07, the cryptocurrency finds itself at a critical technical crossroads. While the broader market remains fixated on short-term price fluctuations and ongoing downward momentum, analytical voices like Blacksea and Celal Kucuker point to well-established historical patterns that suggest a dramatic shift is approaching.
Whether XRP undergoes one final, painful shakeout to flush out leverage before surging toward all-time highs, or whether it respects its macro support zones to launch a historic Cup and Handle breakout, the coming weeks will likely determine the asset’s trajectory for the remainder of the market cycle. Investors are advised to remain vigilant, balance risk-reward ratios carefully, and monitor key support thresholds closely as the setup matures.