XRP Monthly RSI Slumps to Unprecedented 41.64 Low, Outpacing Even the March 2020 Bear Market Depth
Main Facts
The digital asset market has entered a punishing stretch of volatility, and Ripple’s XRP is bearing a historic brunt of the pressure. According to technical data circulating across analytical platforms, XRP’s monthly Relative Strength Index (RSI) has plummeted to an unprecedented low of 41.64. This figure marks the weakest reading ever recorded for the token on a monthly timeframe, officially eclipsing the previous nadir of 43.75 set in March 2020.
For crypto market veterans, the March 2020 candle carries deep significance. It marked the absolute price floor for XRP at $0.11 during one of the most violent, pandemic-induced liquidity crises in financial history. That the current monthly RSI has dug even deeper than that generational capitulation event has sent shockwaves through the Ripple community.
However, technical analysts emphasize a critical caveat: the current monthly candle for June remains open. Because the RSI calculates values dynamically based on price action throughout the duration of a candle, the 41.64 reading is not yet etched in stone. Market data indicates that if XRP can mount a meaningful recovery back above the $1.30 threshold before June concludes, the monthly RSI will correct upward, potentially erasing the significance of this historic warning signal altogether.
At the time of writing, XRP is changing hands at approximately $1.11. This price point represents a staggering 61% correction from its multi-year high of $2.84, which was minted in October 2025. The steep downward trajectory has unfolded over several months of relentless selling pressure, completely devoid of any sustained relief rallies that might have offered respite to long-term holders.
Furthermore, the token’s broader valuation has taken a severe hit. XRP’s market capitalization evaporated from $82.5 billion at the start of the week down to approximately $69 billion—a sharp 15% drop in a matter of days that has dragged prices back to levels last witnessed in early February.
Chronology
To understand how XRP arrived at this historical technical crossroads, it is necessary to trace the timeline of the current market cycle and the sudden acceleration of the token’s decline.
- October 2025: XRP reaches its cycle peak, touching $2.84 amid a wave of optimism and robust network activity. This height serves as the benchmark for the subsequent downtrend.
- Late 2025 to Early 2026: The token enters a protracted, grinding bear phase. Instead of a sharp, V-shaped correction, XRP experiences a slow bleed, grinding down support levels over multiple months without a substantial recovery phase.
- Early February 2026: XRP touches price levels near $1.10—a psychological and technical floor that would eventually be revisited months later during the summer market contraction.
- Early June 2026: The broader crypto market experiences a catastrophic macro shock. Bitcoin stumbles toward the $63,000 mark following confirmations of corporate asset sales, dragging the total crypto market capitalization down by an astonishing $330 billion in a single week.
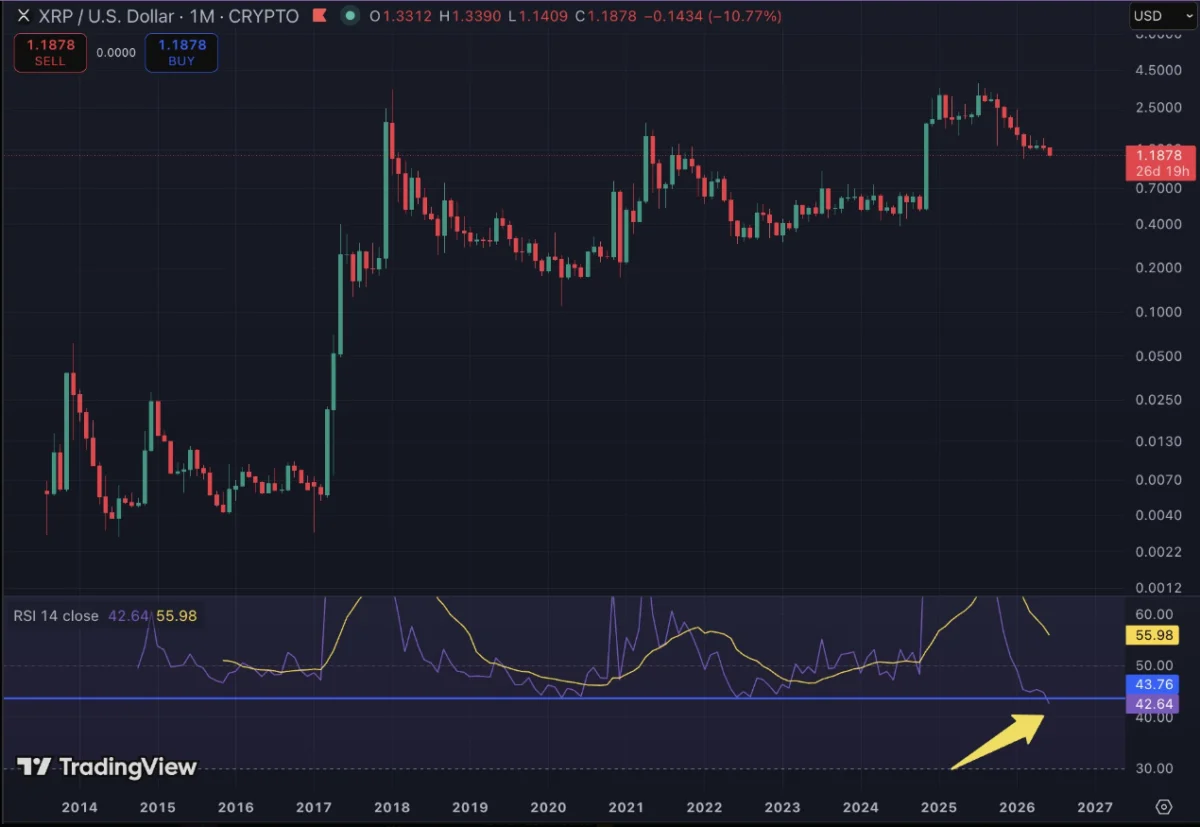
- June 4, 2026: Prominent XRP market commentator Austin (@Austin_XRPL) publishes a chart on social media flagging a historic milestone. His initial analysis shows the monthly RSI sliding to 42.64 as XRP prices slip to $1.18.
- Mid-June 2026: As selling pressure intensifies and the token’s price dips further to $1.11, the monthly RSI ticks down even further to 41.64, officially breaking the March 2020 all-time low record.
Supporting Data
Technical indicators provide the framework through which traders evaluate momentum, exhaustion, and potential market reversals. To contextualize XRP’s current predicament, a detailed examination of the data is required.

The Relative Strength Index (RSI) is a momentum oscillator that measures the speed and magnitude of recent price changes to evaluate overvalued or undervalued conditions in the price of a stock or other asset. Traditionally, an RSI reading below 30 on standard timeframes is considered deeply oversold, signaling that panic selling may have exhausted itself and a relief bounce could be imminent.
While XRP’s monthly RSI reading of 41.64 technically sits above the absolute 30 threshold, its significance lies in its relative historical context. Because XRP has spent much of its trading life in high-beta bull cycles or suppressed by long-standing regulatory overhangs, its monthly momentum has rarely compressed to such depressed levels. The fact that 41.64 is lower than the March 2020 reading of 43.75—when XRP bottomed at $0.11—illustrates a profound lack of aggressive buying interest over the macro timeframe.
The token’s price action mirrors this statistical fatigue. Trading at $1.11, XRP is down roughly 61% from its October 2025 peak of $2.84. This downward momentum has been exacerbated by sector-wide contagion. Over the first week of June alone, the total cryptocurrency market cap shed $330 billion. This massive liquidity drain was triggered in part by Bitcoin sliding toward $63,000, a move catalyzed when Strategy (the enterprise software firm closely associated with Michael Saylor) confirmed it had sold 32 BTC from its colossal reserve of over 800,000 Bitcoins—a rare divestment that spooked institutional and retail sentiment alike.
Official Responses and Community Reactions
In the decentralized world of cryptocurrency, community sentiment and prominent analysts often serve as the first line of interpretation when uncharted technical territory is reached.
The discovery of the historic RSI low was brought to light by community analyst Austin, who took to social media platform X (formerly Twitter) to share his findings with the broader market. Posting his technical breakdown, Austin stated unequivocally: "XRP is the most oversold on the monthly time frame that it has EVER been."
His initial alert, which highlighted a reading of 42.64 at a price point of $1.18, quickly reverberated across trading circles. As prices degraded further toward $1.11 and the indicator printed 41.64, panic and philosophical debates regarding the nature of cycle bottoms intensified within the XRP community.
While many retail investors viewed the signal as a dire omen of further downside, veteran market participants pointed out the historical parallels to past market structures. Commentators noted that while indicators can remain depressed for extended periods, historical cycle extremes have frequently served as the foundational base for explosive multi-year macro reversals.
Implications
The descent of XRP’s monthly RSI to a historic low of 41.64 carries profound implications for short-term speculators, long-term holders, and institutional stakeholders alike.
1. The Power of the Monthly Candle Close
The immediate implication centers on the behavior of the market over the remainder of June. Because the monthly candle remains open, the 41.64 figure is technically fluid. If macroeconomic conditions stabilize or if a sudden liquidity inflow pushes XRP back above the $1.30 resistance zone before month-end, the RSI will correct upward. This would render the current warning a false alarm or a temporary intraday/intra-month anomaly. Conversely, if June closes near current prices, the permanent printing of a sub-42 monthly RSI will confirm a historic momentum exhaustion event.
2. Historical Precedent vs. Current Realities
Looking back at the March 2020 market crash offers both comfort and caution. In 2020, the RSI low of 43.75 perfectly aligned with the absolute cycle bottom for XRP at $0.11. Following that capitulation, the token established a series of higher lows, eventually marching up to $1.96 by April 2021, and later driving as high as $3.40 in November 2024—a monumental 580% surge from the October lows of that respective year.
If history rhymes, the current oversold readings could signal that XRP is approaching a multi-year macroeconomic accumulation zone. However, analysts warn that historical precedents are never guaranteed to repeat with exact precision. Structural changes in market liquidity, regulatory shifts, and macroeconomic pressures (such as corporate Bitcoin sell-offs and shifting interest rate expectations) mean that current buyers face unique headwinds that did not exist in the post-pandemic liquidity expansion of 2020–2021.
3. Market Psychology and Capitulation Risk
With XRP shedding 15% of its market capitalization in a single week and plunging down to $1.10, retail sentiment is hovering near fear territory. Prolonged bear trends that lack sharp, dramatic flash crashes often inflict more psychological damage on long-term holders than sudden crashes, as the slow bleed gradually drains conviction. Whether this historic RSI reading acts as the final psychological breaking point that washes out remaining weak hands—paving the way for a durable macro bottom—remains the defining question for the asset’s trajectory in the second half of 2026.