Ethereum Plunges Below $1,800: Historic Monthly RSI Drop Sparks Debate Over Cycle Bottoms and Long-Term Recovery
June 2026 — The broader cryptocurrency market has plunged into a profound, suffocating bearish sentiment, pulling the digital asset ecosystem down with it. At the epicenter of this downward pressure is Ethereum (ETH), the world’s leading smart contract platform and second-largest cryptocurrency by market capitalization.
In a brutal sequence of market sell-offs, Ethereum has crashed below the crucial psychological and technical support level of $1,800. This drop places its monthly chart under unprecedented duress. Compounding the misery for long-term holders and institutional investors alike is a hidden technical anomaly: Ethereum’s monthly Relative Strength Index (RSI) has plummeted to its lowest reading in the asset’s entire trading history, dating back to its inception in 2015.
While the immediate market reaction has been one of panic and capitulation, seasoned technical analysts are looking past the current red candles. They are focusing on historical precedent. Previous deep RSI resets have famously marked major macro cycle lows for Ethereum—most notably during the capitulation events of 2020 and 2022. As the asset trades deeply depressed, the crypto community is locked in a fierce debate: Are we witnessing the final, agonizing flushing out of weak hands before a historic multi-year recovery, or is Ethereum charting a dangerous new course into uncharted bearish territory?
1. Main Facts: The Anatomy of Ethereum’s 2026 Crash
The ongoing correction represents one of the most punishing drawdowns Ethereum has experienced since the macro bull run peaked in August 2025 at an all-time high of $4,946. Over the subsequent nine months, a relentless structural downtrend has systematically dismantled the gains accumulated during the previous market cycle.
The Breakdown Below Key Levels
- The $1,800 Breach: For months, bulls fought valiantly to keep Ethereum afloat above the $1,800 threshold. However, intensified macroeconomic pressures and broad-based crypto liquidations finally broke this defense, triggering cascading stop-losses.
- New Yearly Lows: In the past 24 hours, ETH prices tumbled as low as $1,536, marking the asset’s weakest performance since the year began. At the time of reporting, Ethereum is hovering around $1,612, leaving market participants scrambling to assess whether further downside is inevitable.
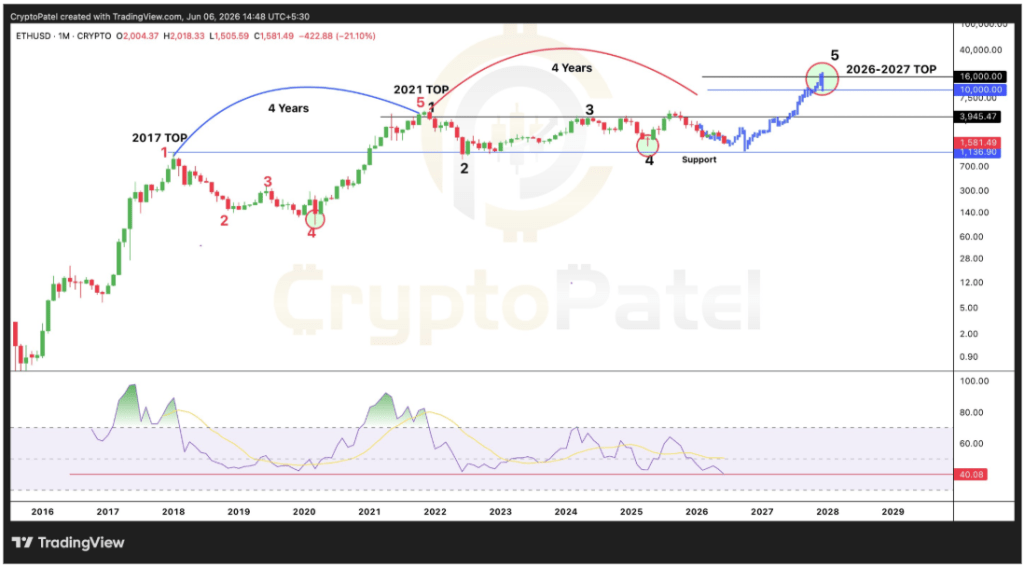
- The Historic RSI Reading: The most startling revelation of this current crash lies within the monthly technical indicators. The monthly Relative Strength Index (RSI)—a momentum oscillator that measures the speed and change of price movements—has plunged to approximately 40. This is the lowest monthly RSI reading ever registered in Ethereum’s history.
2. Chronology of the Downtrend: From All-Time Highs to June Capitulation
To fully grasp the gravity of Ethereum’s current market positioning, it is essential to trace the chronology of events that led the asset from its euphoric highs down to its current sub-$1,700 reality.
- August 2025 (The Peak): Ethereum reached its cycle apex at $4,946, capping off a massive institutional and retail-driven expansion phase. Optimism was widespread, and targets of $10,000 were routinely discussed across financial media.
- Late 2025 (The Slow Bleed): Following the August peak, the market entered a prolonged distribution phase. Rather than a sudden crash, Ethereum suffered a grinding, multi-month bleed, losing key moving averages and slowly draining market liquidity.
- Early 2026 (The Acceleration): As global macroeconomic conditions tightened and regulatory scrutiny persisted, the crypto market sentiment shifted heavily toward risk-off. Altcoins bore the brunt of the capital flight, with Ethereum losing critical support platforms one by one.
- June 2026 (The Capitulation): The dam finally broke in early June. Ethereum crashed decisively under $1,800, dipping to a 2026 low of $1,536. This sharp downward momentum drove the monthly RSI to historic lows, catching even veteran traders off guard.
3. Supporting Data: Historical RSI Parallels and ETF Flows
Financial markets are inherently cyclical, and technical analysts lean heavily on historical data to contextualize extreme price anomalies. The current monthly RSI reading of ~40 demands a comparative look at past structural bottoms.

The 2020 and 2022 Precedents
- The 2020 Cycle Reset: Back in March 2020—amidst the global market panic triggered by the COVID-19 pandemic—Ethereum’s RSI plummeted into deeply depressed territory. What followed was one of the most legendary rallies in crypto history, with ETH surging from roughly $88 to an explosive 2021 peak above $4,800.
- The 2022 Bear Market: Following the collapse of major industry entities (such as Terra/Luna and FTX), Ethereum’s RSI underwent another profound reset. This set the stage for a recovery from approximately $880 up to the 2025 all-time high of nearly $5,000.
In both instances, extreme monthly RSI contractions did not signal the death of the asset; rather, they acted as compressed springs, signaling that the asset was heavily oversold and primed for a macro trend reversal.
Institutional Flows: Spot Ethereum ETFs Show Mixed Signals
Institutional sentiment, as tracked via Spot Ethereum Exchange-Traded Funds (ETFs), reflects the current indecision in the broader market:
- The Brief Respite: On Thursday, June 4, Spot Ethereum ETFs broke a grueling 17-day consecutive streak of net outflows, recording $19 million in net positive inflows. This sparked brief optimism that institutional capital was finally stepping in to defend the $1,600 support zone.
- Immediate Reversal: That relief proved to be short-lived. By Friday’s trading session, the momentum reversed sharply, with ETFs sliding back into negative territory and bleeding $5.97 million in net outflows. This fragility highlights the hesitation of institutional players to commit heavy capital while macro headwinds remain fierce.
4. Official Responses and Analyst Commentary
As Ethereum breaches critical technical boundaries, prominent voices within the crypto analysis community have offered contrasting perspectives on what the future holds.
Market analysts observing the macro timeframe point out that while the current setup shares striking structural similarities to past cycle bottoms, it also features a unique twist. Because the monthly RSI has dropped even lower than in previous cycles, the reading is officially the most extreme in Ethereum’s history.
Proponents of long-term cyclical theories argue that this extreme reading could preface an explosive recovery. Technical projections mapped across multi-year monthly candlestick charts suggest that Ethereum is operating within a predictable four-year macro cycle model—mirroring the structural transition from the 2017 top to the 2021 top. Under this technical framework, some analysts project that once this capitulation phase exhausts itself, a subsequent bull expansion could push Ethereum toward ambitious long-term targets, such as a projected cycle peak around $10,000 heading into late 2026 and 2027.
Conversely, conservative voices warn against blindly trusting historical patterns during periods of unprecedented macroeconomic volatility. They emphasize that until Spot Ethereum ETFs sustain multi-week inflows and macro liquidity conditions improve, retail and institutional investors should exercise extreme caution.
5. Implications for Investors and the Broader Market
The ramifications of Ethereum sitting below $1,800 with a historically depressed RSI stretch far beyond simple price action. They carry profound implications for various market participants:
For Retail Investors
Retail traders are facing a classic test of psychological endurance. Buying heavily oversold assets during a period of peak fear often yields massive asymmetric upside over a multi-year horizon; however, it also exposes investors to the pain of catching a "falling knife" if prices continue to spiral downward in the short term.
For DeFi and the Broader Ecosystem
Ethereum serves as the foundational settlement layer for decentralized finance (DeFi), non-fungible tokens (NFTs), and Layer-2 scaling networks. When ETH’s fiat value drops precipitously, it impacts total value locked (TVL), strains over-collateralized borrowing protocols, and dampens developer activity across the ecosystem.
For Bulls and the $1,600 Defense Line
At the present trading price of $1,612, the immediate burden rests squarely on the shoulders of the bulls. To prevent a deeper descent toward psychological support at $1,500 or lower, buyers must step in with sustained, aggressive spot inflows. A failure to defend the $1,600 region could accelerate liquidations, whereas a successful defense—backed by a stabilizing RSI—might validate the theory that this summer drop is simply the final, darkest hour before Ethereum’s next major macro expansion.