
Ethereum’s Historic RSI Reset: A Ominous Warning or the Setup for a Parabolic Breakout?
The cryptocurrency market is currently navigating a period of profound volatility, with Ethereum (ETH)—the industry’s leading smart contract platform—finding itself at a critical technical crossroads. As of early June 2026, the asset has suffered a significant price contraction, plummeting below the psychological support level of $1,800. This downward trajectory has not only rattled investor confidence but has also triggered a rare technical signal: Ethereum’s monthly Relative Strength Index (RSI) has hit its lowest level since the network’s inception in 2015.
As the broader crypto market grapples with a heavily bearish sentiment, analysts are divided. Is this "extreme" RSI reading a harbinger of further capitulation, or is it the definitive signal of a bottoming process that historically precedes massive, multi-year bull cycles?
The Anatomy of the Crash: Main Facts
The current market structure for Ethereum is characterized by a "brutal" nine-month downtrend. Since touching a peak of $4,946 in August 2025, ETH has faced relentless selling pressure. By the first week of June 2026, the price action intensified, breaking below the $1,800 threshold and dipping as low as $1,536 within a 24-hour window. This represents the lowest price point for the asset in the current calendar year.
The most alarming aspect of this downturn is the behavior of the monthly RSI. The RSI is a momentum oscillator that measures the speed and change of price movements, typically ranging from 0 to 100. When the indicator drops toward the 30-40 range, it suggests that an asset is "oversold." Ethereum’s current reading—hovering near 40 on the monthly timeframe—is unprecedented in the asset’s decade-long history. This deep reset signifies a level of exhaustion in the selling pressure that has never been documented since Ethereum began trading.
A Chronology of Market Cycles
To understand the gravity of the current situation, one must look at the historical context of Ethereum’s price cycles. The current market structure appears to be mirroring the cyclical behavior seen in previous years, specifically the 2020 and 2022 troughs.
2020: The Pandemic Reset
In early 2020, Ethereum’s RSI reached depressed levels amid global economic uncertainty. Following this technical reset, the asset embarked on a legendary rally, climbing from approximately $88 to its 2021 peak of over $4,800. This period served as a testament to the idea that deep RSI resets often flush out weak hands before a major structural bull run.

2022: The Post-Bull Market Correction
Following the 2021 highs, Ethereum faced a prolonged bear market. In 2022, the monthly RSI once again hit extremely low levels, echoing the 2020 setup. This reset preceded the rally that eventually saw Ethereum climb from a local bottom of $880 to its all-time high of nearly $5,000 in 2025.
2026: The "Most Extreme" Reading
The current 2026 cycle differs from its predecessors in one key metric: the intensity of the RSI drop. Because the current reading is the lowest in history, some analysts argue that the impending recovery, should it materialize, could be even more explosive than the rallies seen in 2020 or 2022. The market is currently testing whether the "Golden Triangle" of technical support—a pattern of consistent historical bottoms—can hold against macroeconomic headwinds.
Supporting Data and Technical Projections
Beyond the RSI, the technical outlook for Ethereum is being analyzed through the lens of long-term four-year cycles. Technical analysts often compare the current move to the transition from the 2017 market top to the 2021 top.
The $10,000 Projection
Despite the current bearish atmosphere, long-term projections remain ambitious. Analysts tracking the "Golden Triangle" theory suggest that Ethereum is currently completing the final phase of its contraction. If the four-year cycle holds, technical projections point toward a potential cycle top in the $10,000 range between late 2026 and 2027. This theory posits that the current "weakness" is merely the final shaking out of the market before a period of aggressive expansion.
ETF Inflows and Institutional Sentiment
A major point of contention in the current market is the role of institutional capital. Spot Ethereum ETFs, which were designed to provide stability, have shown a mixed performance. For instance, the first week of June 2026 saw a brief glimmer of hope when a 17-day streak of outflows was snapped by a $19 million net inflow on June 4. However, the relief was ephemeral. By Friday, June 5, the market returned to net negative territory with $5.97 million in outflows, highlighting the lack of conviction currently held by institutional investors.
Official Responses and Market Perspectives
While there are no "official" institutional statements regarding the RSI, the sentiment among high-profile market analysts on platforms like X (formerly Twitter) has shifted toward a "wait-and-see" approach.
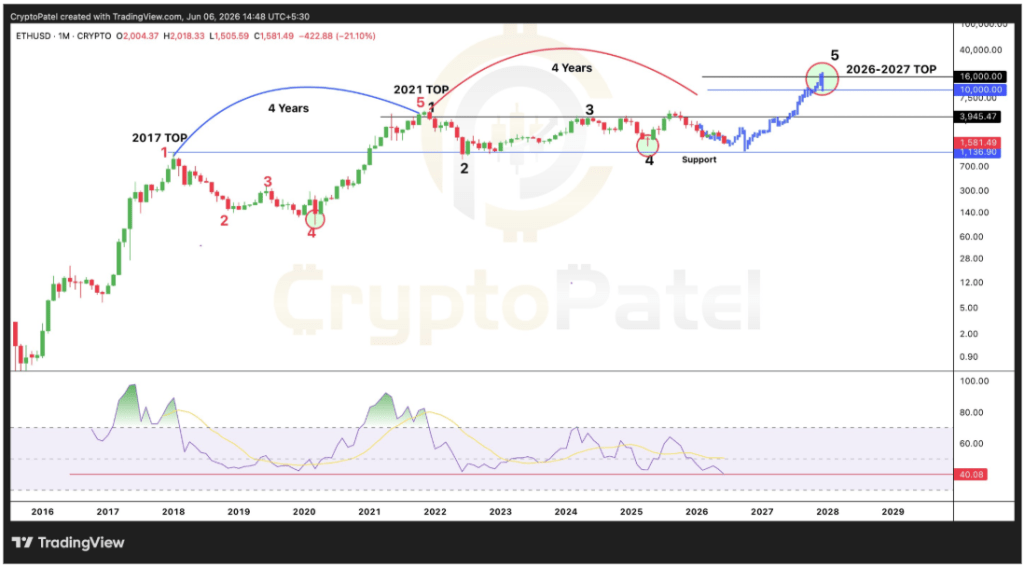
Market observers like @CryptoPatel have highlighted that while history does not repeat itself exactly, it often rhymes. The consensus among the analyst community is that the $1,600 region is the "make-or-break" zone for the bulls. If institutional inflows from ETFs do not pick up significantly to defend this level, the risk of a "wick down" to lower liquidity zones remains high. Conversely, a sustained defense of the $1,600 area could provide the foundation for a base-building period that lasts through the third quarter of 2026.
Implications: What Comes Next?
The current state of the Ethereum market carries several major implications for both retail and institutional participants:
- The Capitulation Risk: The extreme RSI reading suggests that we are in the "capitulation" phase. Historically, this is the point where the final wave of investors gives up, providing the "smart money" with an opportunity to accumulate at depressed prices.
- Institutional Dependency: The volatility of the Ethereum ETF flows underscores that the market is currently sensitive to external macro data (such as Federal Reserve interest rate policies and inflation reports). Until these flows turn consistently positive, Ethereum may struggle to regain the $2,000 level.
- The Long-Term Thesis: For those holding a multi-year horizon, the current technicals are not viewed as a disaster, but as a standard deviation in a long-term uptrend. The "Golden Triangle" theory suggests that the volatility of 2026 is merely noise within the broader adoption cycle of smart contract technology.
Conclusion: The Bullish Case for the Bearish RSI
While the price action is undoubtedly grim, the rarity of the current monthly RSI reading provides a compelling argument for contrarian investors. In the history of Ethereum, the most extreme oversold readings have consistently marked the transition from a bear market to a parabolic growth phase.
As Ethereum defends the $1,600 region, the market remains on a knife-edge. Traders are advised to monitor ETF flows as a primary gauge of institutional intent, while keeping a close eye on the monthly close. If the month closes with an RSI rebound, it may signal that the worst of the 2026 correction is officially behind us, paving the way for the next chapter in Ethereum’s evolution toward its projected $10,000 target. Until then, caution remains the order of the day as the market continues to reconcile its historical patterns with the current macroeconomic reality.