Ethereum’s Silent Consolidation: Analyzing the Divergence Between Retail Apathy and Whale Accumulation
Ethereum currently finds itself in a state of suspended animation, tethered below the $1,700 psychological threshold. For the average market participant, the prevailing sentiment is one of frustration; the asset lacks the momentum for a robust recovery, yet it has not succumbed to a total capitulation event. However, beneath this veneer of apathy, a complex shift in market architecture is occurring. Recent on-chain data suggests that while the retail public has largely stepped to the sidelines, institutional-grade capital is undergoing a quiet, strategic reconfiguration.
The On-Chain Divergence: A Sign of Structural Maturation
The most compelling narrative emerging from the current data—provided by CryptoOnchain—is a stark divergence between transaction volume and transaction value. Over the past week, the Ethereum network witnessed a 43% decline in daily transactions from standard user wallets. In any typical market cycle, such a figure would be cited as definitive proof of a network in decline, suggesting a loss of utility and user interest.
Yet, this surface-level interpretation fails to account for the qualitative shift in activity. Simultaneously, the average value per transaction has surged by more than 184%, with median transfer sizes increasing at an even more aggressive clip. This indicates that while the "noise" of small-scale retail activity has subsided, the "signal" of high-conviction institutional movement has intensified.
This pattern is a historical hallmark of periods preceding significant market volatility. It suggests that smaller, speculative participants have exited the arena due to uncertainty, while larger holders—the "whales"—are consolidating their positions. By moving larger tranches of capital in fewer transactions, these entities are engaging in deliberate portfolio management rather than the high-frequency churn characteristic of a retail-dominated market.

Chronology of the 2026 Correction
To understand the current positioning, one must look back at the market’s trajectory over the first half of 2026. The year began with a period of intense, albeit shaky, consolidation between February and May, with Ethereum oscillating in the $1,800–$1,900 range. This zone was widely considered the bedrock of support for the year.
By early June 2026, the structural integrity of that support zone finally gave way under persistent selling pressure. The breakdown was swift and decisive, pushing Ethereum toward the $1,500 range—a level not seen in months. The following chronology outlines the key phases of this decline:
- Q1 2026: Ethereum establishes a stable, albeit uninspired, trading range between $1,800 and $2,000. Market participants remain optimistic about a potential breakout.
- April–May 2026: A failed recovery attempt peaks near $2,400. This peak forms a "lower high," signaling a loss of bullish momentum and the beginning of a bearish trend.
- Early June 2026: The $1,800 support level is breached. The resulting capitulation leads to a massive volume spike, indicating that long-term holders were forced to liquidate or hedge, pushing the price toward $1,500.
- Mid-June 2026: Price discovery enters a precarious state. Ethereum finds minor support at $1,500, but fails to reclaim previous resistance levels, leaving the market in a state of high-alert stagnation.
Supporting Data: Supply Contraction and Stablecoin Inflows
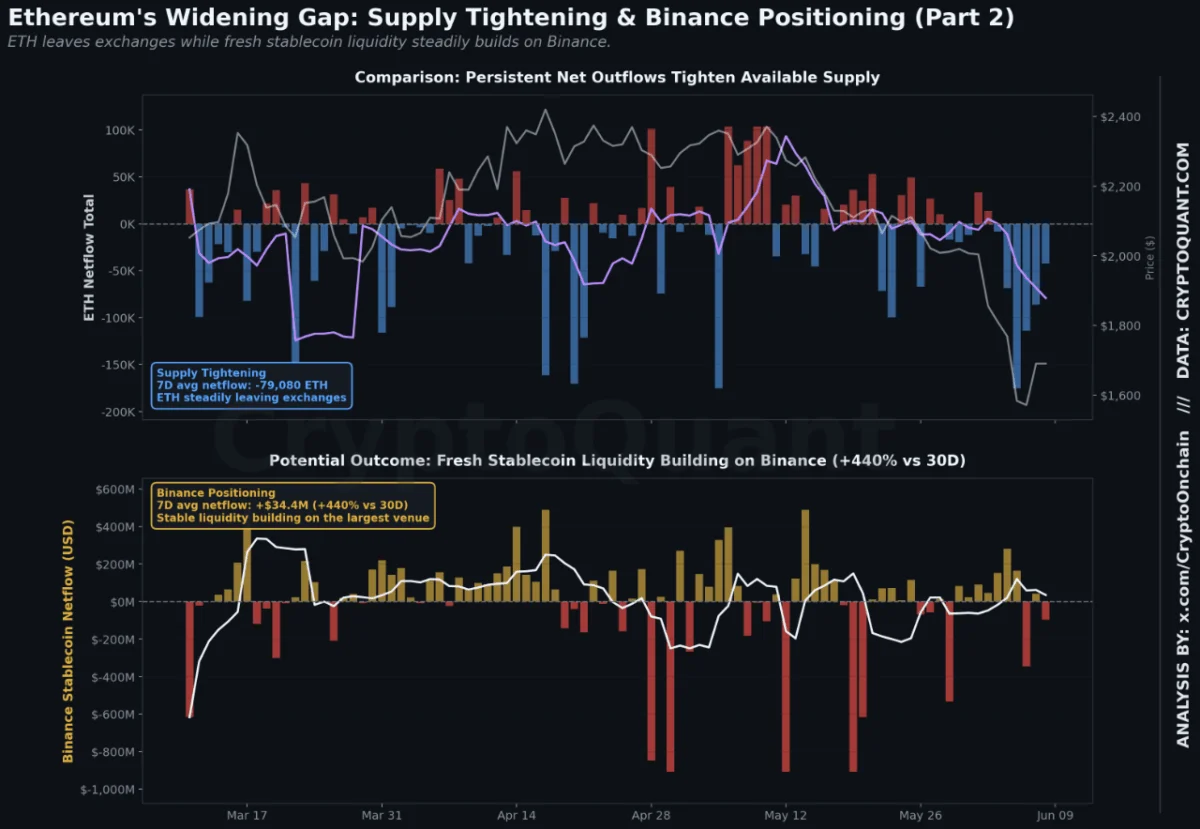
The bearish price action on the charts is countered by intriguing data regarding liquidity flows. Total ETH netflows remain deeply negative, hovering around -79,080 ETH. This indicates a consistent, ongoing withdrawal of Ethereum from centralized exchanges into private, long-term storage. When combined with the high-value transactions noted earlier, it paints a picture of a shrinking "float"—the amount of ETH readily available for sale on exchanges is decreasing, even as the price remains depressed.
Conversely, fresh "dry powder" is accumulating on major exchanges. Stablecoin netflows into Binance have spiked, showing a 440% increase relative to the 30-day average, totaling roughly $34.4 million. This is a critical indicator: smart money is not necessarily exiting the ecosystem; rather, it is positioning itself in stable assets, waiting for the optimal entry point to re-enter the market.

Furthermore, Open Interest (OI) on Binance has expanded by approximately 9% over the current quarter. This suggests that while spot markets are seeing supply consolidation, the derivatives market is seeing an increase in hedging or leveraged positioning. This combination of "buying power" sitting on the sidelines and "spot supply" being vacuumed up from exchanges creates a classic structural setup for a sharp move, provided a macro catalyst arrives to trigger the latent demand.
Technical Implications: The Battle for $1,500
From a technical standpoint, the market structure remains firmly in the hands of the bears. Ethereum is trading significantly below its 50-, 100-, and 200-day moving averages, which act as a formidable ceiling for any potential rally. The recent breakdown has essentially turned all previous support levels into overhead resistance.
The immediate technical objective for the bulls is the $1,500–$1,550 zone. If this support holds, it could provide the necessary base for a prolonged consolidation, allowing the market to "wash out" the remaining weak hands. However, analysts warn that any rally failing to break back above $1,800 should be treated with extreme caution. Reclaiming the $1,800 level is essential to invalidate the current "lower high" sequence and shift the bias back toward a recovery.
Without a move back into the $1,800 range, the current market environment remains one where "dead cat bounces" are likely to be met with renewed selling pressure. The market is currently searching for a true bottom, and until the $1,800 resistance is tested and breached, the path of least resistance remains skewed to the downside.

Strategic Outlook and Market Implications
The current divergence between the declining retail transaction count and the increasing average transfer value is not merely a statistical anomaly—it is a signal. It suggests that the market is undergoing a transition from a speculative retail-driven asset class to one defined by institutional accumulation.
For the observer, the primary takeaway is that the "structural decline" narrative may be premature. While the price action is undoubtedly grim, the movement of ETH into private wallets and the simultaneous buildup of stablecoin liquidity on exchanges are indicators of a market preparing for a transition.
However, investors must temper their expectations with reality. These indicators do not guarantee a near-term reversal. Structural setups, regardless of how bullish they appear on-chain, require catalysts to activate. Whether that catalyst comes from macroeconomic policy shifts, regulatory clarity, or a sudden resurgence in decentralized finance (DeFi) activity remains to be seen.
Ultimately, Ethereum is currently in a state of "forced patience." The market is consolidating in the hands of those who are willing to wait for the next cycle. For the average participant, the lesson of the current period is clear: when the crowds are silent and the retail volume dries up, the underlying data often reveals where the "smart money" is placing its bets. As the battle for the $1,500 floor continues, the market remains in a state of high-stakes equilibrium, waiting for the next major movement to define the trend for the remainder of the year.