XRP Hits Historic RSI Lows: A Critical Inflection Point or a Bearish Trap?
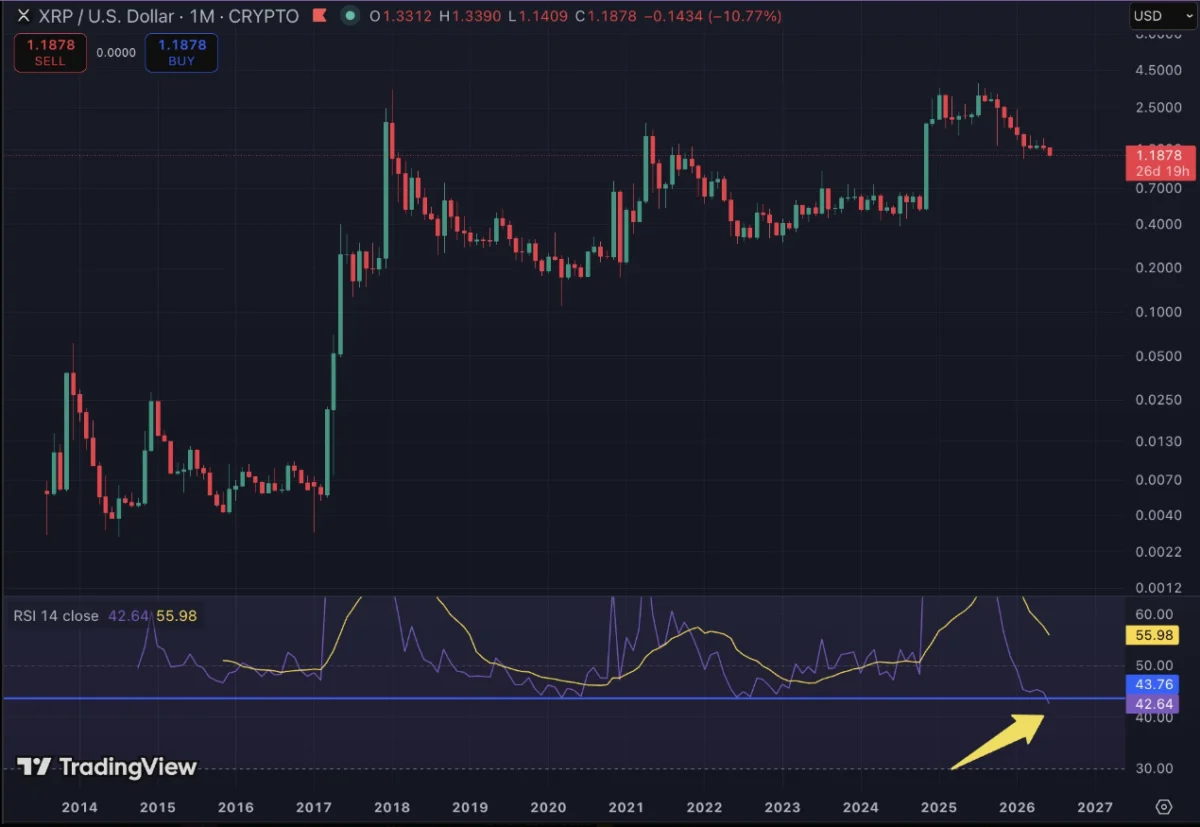
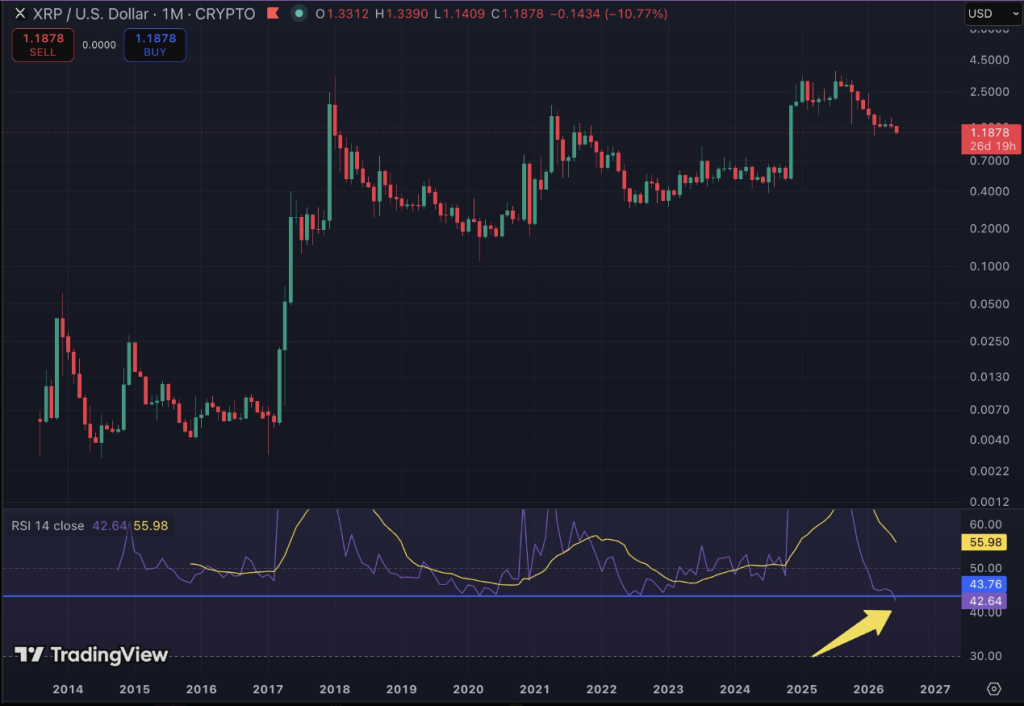
The digital asset landscape is currently navigating a period of intense volatility, and XRP finds itself at the epicenter of a technical anomaly that has captured the attention of market analysts and retail investors alike. As of mid-June 2026, the monthly Relative Strength Index (RSI) for XRP has plummeted to 41.64—a level that marks the lowest reading in the asset’s recorded history. This figure eclipses the previous historic low of 43.75, set during the infamous market capitulation of March 2020, when XRP bottomed out at $0.11 during one of the most punishing bear markets in crypto history.
This development has triggered a firestorm of debate across social media and financial forums. While some market participants interpret this as a sign of terminal exhaustion, others view it as a potential "springboard" for a massive, cyclical reversal.
A Signal With A Caveat: The Fragility of Technicals
While the current RSI reading of 41.64 is numerically significant, market experts caution against treating it as an immutable signal. Because June is still active, the monthly candle has not yet finalized. Technical indicators—particularly those based on monthly timeframes—are highly sensitive to late-month price action.
Prominent XRP market commentator "Austin" was the first to draw public attention to the shift. In a viral social media post, Austin highlighted that the RSI drop coincided with XRP’s slide toward $1.18. As the price subsequently retreated further to current levels around $1.11, the indicator sank deeper into uncharted territory.
However, the "pivot potential" remains high. Analysts suggest that if XRP manages a robust recovery, rallying above the $1.30 threshold before the month concludes, the monthly RSI will likely adjust upward, potentially nullifying the "historic low" signal entirely. This creates a state of technical limbo where the current reading is as much a reflection of recent downward momentum as it is a placeholder that could be wiped away by a single strong weekly close.
Chronology of a Correction
The current decline is not an isolated event but the culmination of a protracted cooling-off period. To understand the gravity of the situation, one must look at the recent trajectory of the asset:
- October 2025: XRP reaches a significant cyclical peak of $2.84, buoyed by market optimism and favorable macroeconomic conditions.
- Late 2025 – Early 2026: A steady, multi-month contraction begins, characterized by lower highs and lower lows, reflecting a broader shift in investor risk appetite.
- Early June 2026: As the token slips to $1.18, the RSI hits a new record low of 42.64, shattering the 2020 record.
- Mid-June 2026: The price further compresses to approximately $1.10–$1.11, pulling the RSI to its current 41.64 level.
This decline represents a staggering 61% pullback from the October 2025 highs. Unlike previous corrections, which were often punctuated by sharp "V-shaped" recoveries, this current trend has been characterized by a lack of meaningful buying volume, leading to a slow, grinding attrition of market value.

Supporting Data: The Broader Market Context
XRP’s struggles do not exist in a vacuum. The entire cryptocurrency ecosystem has faced significant headwinds this week. The total crypto market capitalization saw a massive evaporation of $330 billion within a seven-day window, driven by a cocktail of macroeconomic uncertainty and specific institutional movements.
Notably, the firm associated with Michael Saylor recently confirmed the sale of 32 BTC from its massive treasury—a move that, while statistically negligible compared to their total holdings of over 800,000 BTC, served as a psychological catalyst for bearish sentiment across the market. Bitcoin, acting as the market bellwether, retreated toward the $63,000 level, dragging altcoins—including XRP—along with it.
The impact on XRP’s market capitalization has been acute. At the start of the current week, the token commanded a market cap of $82.5 billion. By the time of this writing, that figure had shrunk to approximately $69 billion, representing a 15% loss of value in just a few days. The current price of $1.10 marks a return to support levels not seen since early February 2026, forcing investors to re-evaluate whether these levels will act as a floor or a gateway to further downside.
Historical Precedents and Market Psychology
The RSI is a momentum oscillator that measures the velocity and magnitude of price changes. Traditionally, a reading below 30 is considered "oversold," suggesting that the asset is undervalued and due for a reversal. At 41.64, XRP is technically not yet in the "oversold" zone by standard definitions, but for an asset that historically maintains much higher momentum, this level represents a profound breakdown in buying interest.
History offers a compelling, albeit singular, point of comparison: 2020. Following the March 2020 RSI low, XRP experienced a period of consolidation followed by a massive breakout. From that low, the asset formed a series of higher lows, climbing to $1.96 by April 2021. Later, in November 2024, the token surged to $3.40, marking a 580% gain from its October 2024 lows.
While history does not repeat itself, it often rhymes. Proponents of XRP argue that the current RSI reading is a classic "bear trap"—a situation designed to shake out weak hands before a major upward move. Conversely, skeptics argue that the regulatory and market environment of 2026 is vastly different from 2020, and that relying on historical chart patterns in an evolving market can be a dangerous exercise in confirmation bias.
Implications for Investors and the Market
For the institutional and retail holders of XRP, the current RSI signal presents a complex set of implications:
1. The Risk of Capitulation
If the monthly candle closes at or near current RSI levels, it could signal to algorithmic trading desks that the asset has entered a "regime change" of low momentum. This might trigger further automated selling, potentially testing psychological support levels below the $1.00 mark.
2. The Case for Value Investing
For contrarian investors, the record-low RSI is a primary indicator of a "buy-the-dip" scenario. The logic here is that when an asset reaches a level of exhaustion never before seen in its history, the probability of a mean reversion becomes statistically significant. If the $1.10 level holds, this could indeed be viewed as one of the best long-term entry points of the cycle.
3. Regulatory and Fundamental Anchors
It is essential to note that RSI is a technical indicator and does not account for fundamental news. Developments regarding Ripple’s ongoing legal landscape, global payment partnerships, and the adoption of the XRPL (XRP Ledger) remain the primary drivers of long-term value. Investors are advised to balance their technical analysis with these fundamental factors, as a favorable court ruling or a major institutional adoption announcement could render current RSI readings irrelevant overnight.
Conclusion: A Turning Point
The current state of XRP is a testament to the volatility inherent in digital assets. Whether the 41.64 RSI reading serves as a historic bottom or a warning of deeper structural weakness remains to be seen. As the month of June progresses, the eyes of the market will remain locked on the price of XRP; if it can reclaim the $1.30 level, the "record low" narrative will fade. However, if the price continues to languish, the community will be forced to prepare for a potentially extended period of volatility.
Ultimately, technical indicators like the RSI are tools for navigation, not crystal balls. In a market governed by liquidity, institutional sentiment, and macroeconomic shifts, XRP’s current historic low is a powerful data point—but it is only one piece of a much larger and more complex puzzle. Investors should approach the coming weeks with caution, keeping a close watch on both the closing monthly candle and the broader developments within the cryptocurrency ecosystem.
Disclaimer: This article is for informational purposes only and does not constitute financial advice. Cryptocurrency investments carry significant risks, and market conditions can change rapidly. Always conduct your own research before making investment decisions.