XRP Hits Historic Technical Lows: Monthly RSI Plummets Past 2020 Bear Market Depths Amid Wider Crypto Market Correction
June 2026 — In a development that has sent ripples through the digital asset community, XRP has registered the lowest monthly Relative Strength Index (RSI) reading in its trading history. Slipping past the bleak milestones of previous market cycles, the token’s technical momentum indicators are flashing deep oversold signals. However, analysts caution that with the monthly candle still wide open, a late-month market recovery could fundamentally alter the narrative before the record books are finalized.
The ongoing sell-off coincides with a punishing broader crypto market correction that has erased hundreds of billions of dollars in valuation within a matter of days. As traders weigh historical precedents against current macroeconomic and sector-specific headwinds, the spotlight remains firmly fixed on whether XRP can defend key psychological price supports.
Main Facts
The current technical milestone centers on XRP’s monthly Relative Strength Index (RSI), a widely utilized momentum oscillator that evaluates the speed and magnitude of recent price directional shifts.
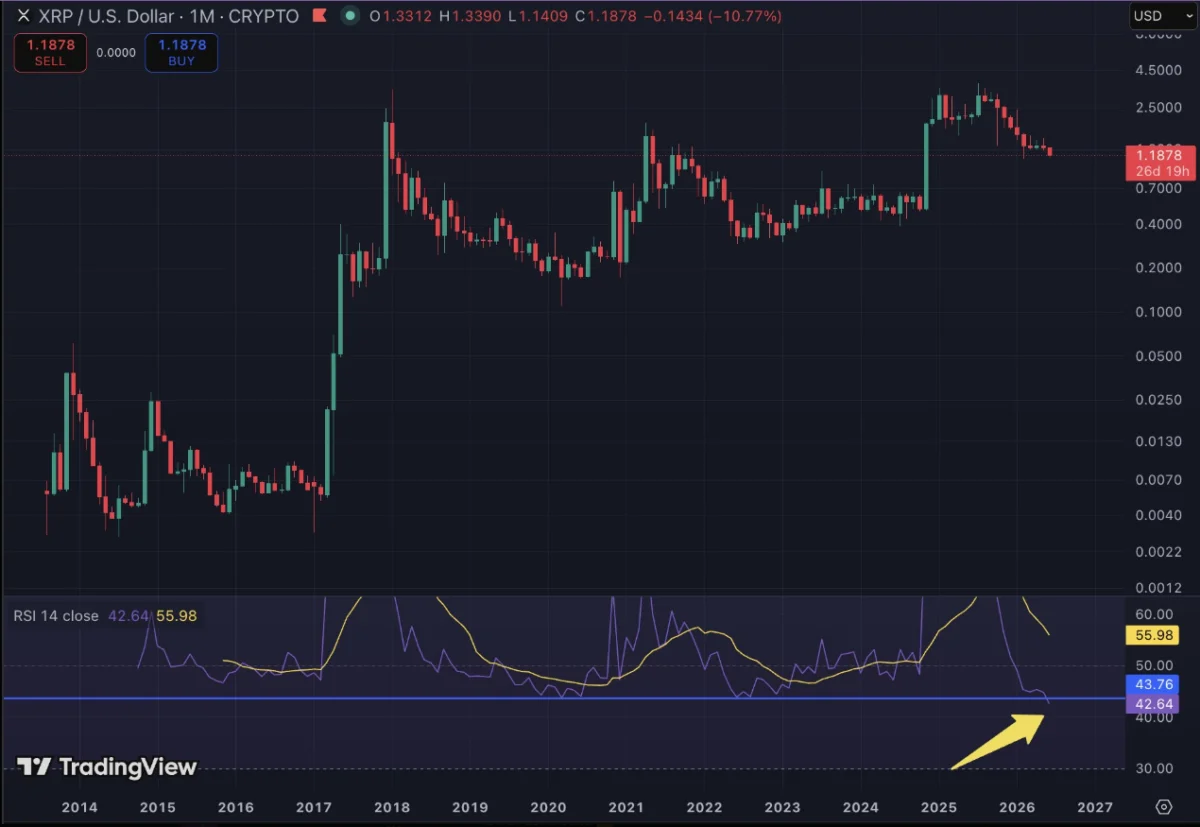
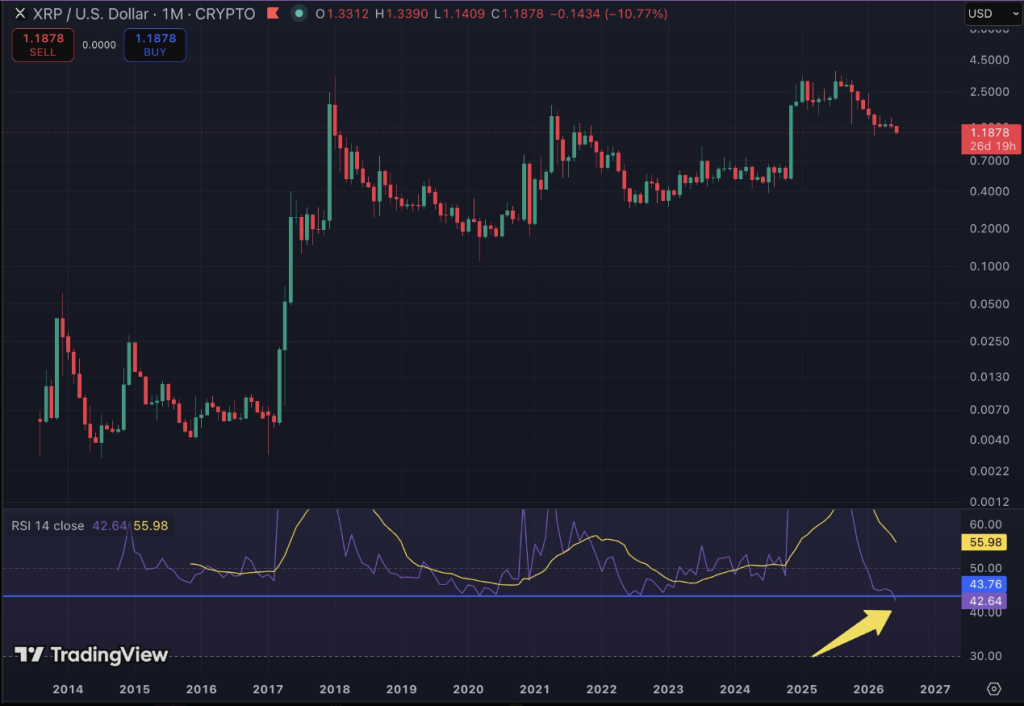
- Record Low RSI: XRP’s monthly RSI has dropped to 41.64. This eclipses the previous historic low of 43.75 recorded in March 2020, during the height of pandemic-driven market panic when the token bottomed out at a meager $0.11.
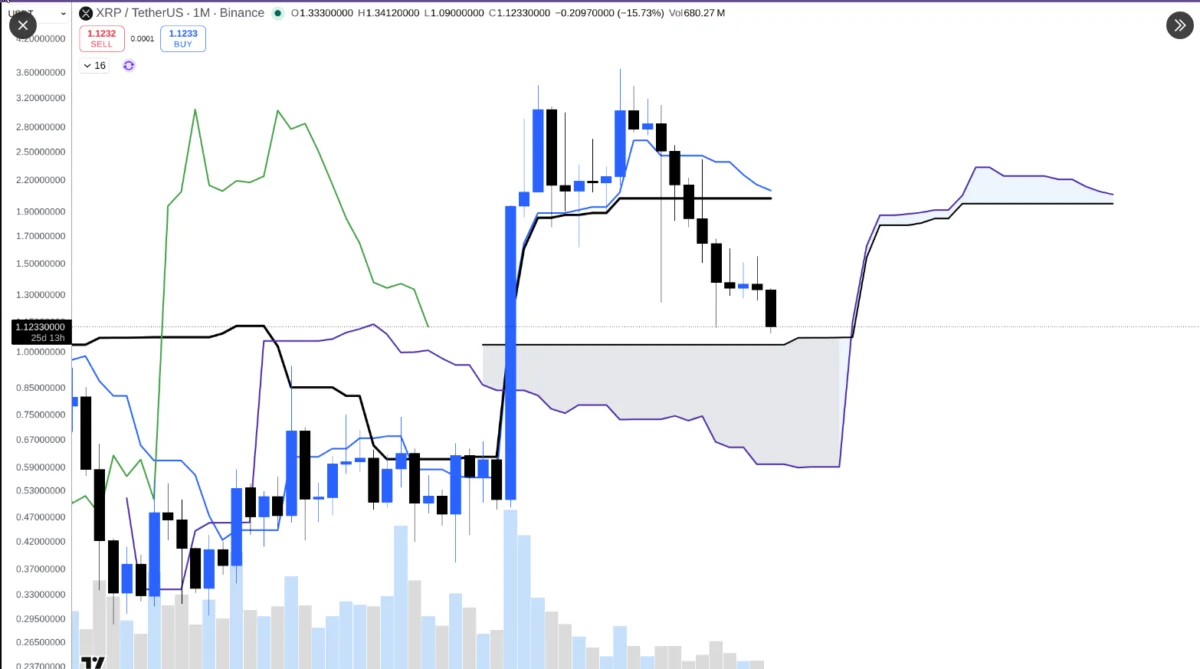
- Current Price Action: At the time of reporting, XRP is changing hands at approximately $1.10 to $1.11. This represents a staggering 61% correction from its October 2025 peak of $2.84, completing a prolonged, multi-month downtrend devoid of any significant relief rallies.
- Market Capitalization Erosion: XRP’s total market capitalization has contracted significantly, sliding from roughly $82.5 billion at the beginning of the week to hover near $69 billion—a sharp 15% reduction in a compressed timeframe that has dragged the token back to price levels last witnessed in early February.
- The Monthly Candle Caveat: While the 41.64 reading marks an all-time low for the monthly time frame, market analysts emphasize that the June candle remains active. If XRP can mount a recovery above $1.30 before the month concludes, the monthly RSI will likely adjust upward, neutralizing the significance of the current statistical low.
Chronology of the Decline
To understand how XRP arrived at this historical technical juncture, it is vital to trace the timeline of its descent over the past several quarters.
October 2025 – The Cycle Peak
XRP reached a robust high of $2.84, buoyed by strong seasonal momentum and optimism across the broader altcoin landscape. This high watermark, however, would mark the apex of the cycle, establishing a formidable ceiling from which a protracted downtrend would soon emerge.
Late 2025 to Early 2026 – The Slow Bleed
Over the subsequent months, XRP failed to mount a meaningful recovery. Instead, it engaged in a grinding downward channel. By February 2026, prices had retreated toward the $1.10 region—a zone that would temporarily act as a cushion before giving way to renewed selling pressure.
Early June 2026 – Public Discovery and the RSI Breach
The technical milestone came to light on June 4, 2026, when prominent XRP community commentator Austin publicly flagged the unprecedented RSI drop via social media. His initial charts indicated an RSI reading of 42.64 alongside a spot price of $1.18.
As the broader cryptocurrency market suffered an accelerated sell-off throughout the week, XRP prices compressed further. This subsequent price depreciation dragged the monthly RSI down to its current historic trough of 41.64, cementing a new technical record for the asset.

Supporting Data and Technical Context
To properly contextualize XRP’s current market posture, analysts frequently look to technical definitions and historical performance metrics.
Understanding the RSI Metric
Traditionally, standard market interpretation dictates that an RSI reading below 30 signals deeply "oversold" conditions, implying that an asset may be undervalued and due for a bullish reversal. Conversely, readings above 70 denote "overbought" territory.
While XRP’s monthly reading of 41.64 technically sits above the traditional 30 threshold, its significance lies internally: it is the lowest monthly reading the asset has ever printed. For an established top-tier cryptocurrency with years of historical trading data, a new low on a macro time frame highlights a severe, prolonged exhaustion of buyer demand.
The Broader Market Contagion
XRP’s struggles are not occurring in a vacuum. The wider digital asset ecosystem experienced severe downward pressure mid-week, triggered by a confluence of macroeconomic factors and high-profile institutional asset adjustments.
Most notably, market sentiment was jolted when Strategy (the corporate entity famously associated with Bitcoin advocate Michael Saylor) confirmed the sale of 32 BTC from its massive treasury holding of over 800,000 Bitcoin. While minor in proportion to their total holdings, the announcement injected a wave of caution into trader psychology. Consequently, the aggregate cryptocurrency market capitalization shed an estimated $330 billion in less than a week, creating a domino effect that battered high-beta altcoins like XRP.
Official and Community Responses
As technical indicators flash red, the digital asset community and market commentators have mobilized to interpret the data.
Prominent figures within the XRP ecosystem have been quick to dissect the charts. Austin, the community analyst who first brought the metric to mainstream attention, emphasized the unprecedented nature of the drop, noting on social media that “XRP is the most oversold on the monthly time frame that it has EVER been.”
Institutional analysts and market observers, however, have urged a balanced perspective. While community sentiment oscillates between panic and speculative accumulation, quantitative traders have focused heavily on the conditional nature of the data. Because the monthly candle has not yet closed, commentary across major trading desks focuses on risk management rather than premature bottom-fishing. Market makers note that macro indicators on high time frames (such as weekly and monthly charts) require confirmation at the candle close to validate true structural shifts.
Implications for Investors and Future Outlook
The convergence of historical lows, severe market-wide liquidations, and ongoing macro uncertainty raises critical questions about what lies ahead for XRP and the broader crypto economy.
Historical Precedents: Looking Back at 2020
Market historians frequently draw comparisons to the March 2020 crash, when global markets reeled from the onset of the COVID-19 pandemic. During that episode, XRP’s monthly RSI hit 43.75 as prices crashed to $0.11.
That historical moment ultimately served as the ultimate macro price floor for that cycle. Following that flush-out, XRP formed a series of higher lows, eventually surging to $1.96 in April 2021 before a subsequent bull run in late 2024 propelled the token as high as $3.40—marking an astronomical 580% gain from its previous cycle lows.
Bulls point to this historical template as evidence that extreme technical oversold readings on macro time frames can occasionally preface historic accumulation phases.
Downside Risks and the Road Ahead
Conversely, skeptics warn that history does not always repeat itself. The current regulatory environment, liquidity conditions, and macroeconomic backdrop differ vastly from the stimulus-fueled rallies of 2020 and 2021. If the broader market correction deepens and Bitcoin fails to hold its critical support zones, altcoins like XRP could experience extended consolidation or further downside drift.
For the immediate future, all eyes remain fixed on the calendar. Whether June closes with the RSI entrenched at historic lows or whether a late-month rally above $1.30 invalidates the signal will dictate the near-term technical outlook. Until then, XRP navigates a delicate high-stakes period defined by extreme technical compression and heightened market-wide volatility.