
Bitcoin at the Precipice: Analyzing Miner Capitulation and the Battle for the $60,000 Support
The cryptocurrency market is currently gripped by a familiar yet high-stakes tug-of-war. As Bitcoin (BTC) teeters near the $60,000 threshold, on-chain analysts and market technicians are converging on a critical question: Are we witnessing the final throes of a bear market, or is the foundation of the digital asset ecosystem beginning to fracture?
Recent price action has pushed Bitcoin below its average cost of production—a metric that historically serves as a "canary in the coal mine" for miner distress. This article dissects the implications of this convergence, examining the interplay between mining economics, technical support levels, and the broader macro sentiment defining the current crypto landscape.
Main Facts: The Intersection of Production Costs and Price
The core of the current market debate rests on a fundamental economic premise: miners, the backbone of the Bitcoin network, require a profitable environment to sustain operations. When the market price of Bitcoin dips below the cost required to mine a single coin—accounting for electricity expenses, hardware depreciation, and operational overhead—the network enters a period of "miner stress."
On June 20, 2026, market analyst shabr.eth highlighted that Bitcoin had once again slipped below its average cost of production. According to the analysis, this threshold is not merely a psychological barrier but a structural one. Historically, when BTC trades below this production cost, it signals that the market is likely approaching the terminal phase of a bear cycle. The theory posits that as weaker, less efficient mining operations are forced to liquidate their BTC reserves to cover operational costs, the market experiences a final flush of selling pressure. Once these "weak hands" are removed from the ecosystem, the supply side typically stabilizes, setting the stage for a potential reversal.
However, industry experts caution that production costs are not a monolith. They fluctuate wildly based on the region of operation, access to renewable energy, the specific efficiency of ASIC hardware, and the network’s current difficulty adjustment. Therefore, while the metric provides a vital framework, it should not be viewed as a standalone buy or sell signal, but rather as a barometer for market health.
Chronology of the Current Market Correction
The path to the current $60,000 zone was not linear. Following a period of aggressive volatility earlier in the year, Bitcoin encountered a sharp correction that tested the conviction of long-term holders.
- Early Q2 2026: Bitcoin enjoyed a period of relative stability, bolstered by institutional interest and expectations of a supply-side squeeze.
- Late May 2026: Market momentum began to wane as macroeconomic headwinds—including shifting interest rate expectations and fluctuating liquidity—forced a re-evaluation of risk-on assets.
- Mid-June 2026: The price action broke key technical levels, sliding toward the $60,000 mark. This decline triggered an influx of "on-chain" activity, with wallets showing increased movement of BTC toward exchanges—a classic sign of potential selling intent.
- June 20, 2026: Analysis from shabr.eth brought the production-cost narrative to the forefront, as the market failed to find a sustained bid above the $64,000 level.
- Present Day: The market remains locked in a range between $60,000 and $62,000, with traders closely monitoring the behavior of large-scale mining entities and the volume of exchange inflows.
Supporting Data: Technical Analysis and Liquidity Sweeps
While the miner-stress narrative provides a fundamental backdrop, the technical reality is equally compelling. TradingView analyst Smart_money_Fx recently identified the $60,000 to $62,000 range as a critical demand zone.
According to the analysis, the recent price drop served to "sweep" liquidity—essentially triggering stop-loss orders from retail traders and leveraged speculators. By clearing out these positions, the market effectively removed the "weak" liquidity that often prevents a sustained rally. The fact that the price has held this zone suggests that there is a wall of institutional or long-term buyer interest at these levels.
Furthermore, when overlaying the production-cost data with this technical demand zone, a narrative emerges: the market is currently testing whether this $60,000 level acts as a floor or a gateway to lower prices. If the price holds here, the market is essentially absorbing the "miner stress" supply. If the support breaks, it could trigger a cascading liquidation event where miners—unable to sustain operations—are forced to dump their remaining BTC, potentially driving the price into the high $50,000 range.

Official Perspectives and Market Implications
The debate over whether this represents a bottom or a continuation of the bear market remains polarized.
The Bearish Perspective: Forced Capitulation
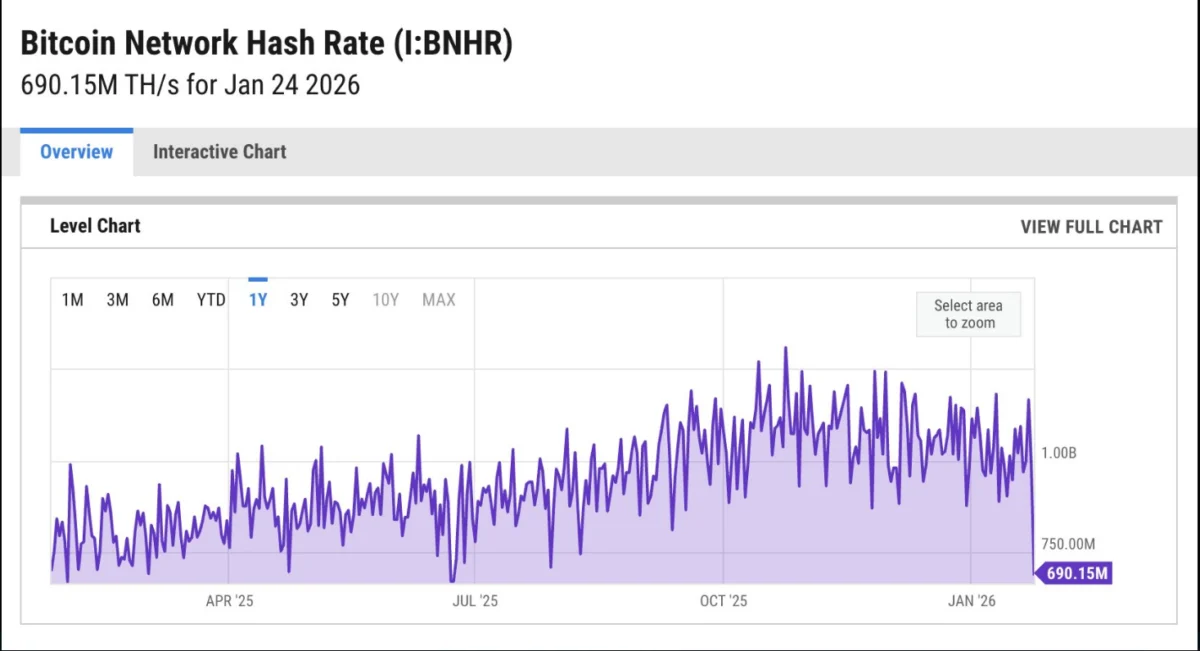
From a bearish standpoint, the inability to reclaim higher levels suggests that demand is insufficient to offset the selling pressure from miners. If hash rate (the total computational power on the network) begins to decline significantly, it would confirm that mining operations are shutting down equipment. This leads to a decline in network security and an increase in the cost of remaining operational, potentially creating a feedback loop of selling.
The Bullish Perspective: The "Final Flush"
Conversely, many bulls argue that the current distress is the final ingredient needed for a bottom. In previous market cycles, the most dramatic recoveries occurred immediately following a period of forced miner capitulation. From this perspective, the current stress is a feature, not a bug, of the market’s self-regulating mechanism. By forcing out inefficient miners, the network becomes more robust, and the price eventually finds a natural equilibrium where supply and demand are once again aligned.
The Macro Context
It is also essential to consider the influence of macroeconomic factors. The crypto market does not exist in a vacuum. High interest rates, inflationary data, and geopolitical tensions all weigh on the liquidity available to the crypto sector. As we move deeper into 2026, the correlation between Bitcoin and traditional risk assets remains high, meaning that even if the miner-stress dynamic resolves, the broader market environment will play a decisive role in whether Bitcoin can reclaim its all-time highs.
What to Watch: Indicators of Strength
For investors and traders looking for confirmation of a trend reversal, simple price consolidation is not enough. Several key indicators would signal that the market has successfully navigated this period of stress:
- Reclaiming Local Resistance: BTC must not only hold the $60,000 support but also convincingly break above the $65,000–$68,000 range to invalidate the current downtrend.
- Market Structure Shift: A series of "higher highs" and "higher lows" on the daily chart is necessary to confirm that the selling pressure has been fully absorbed by institutional demand.
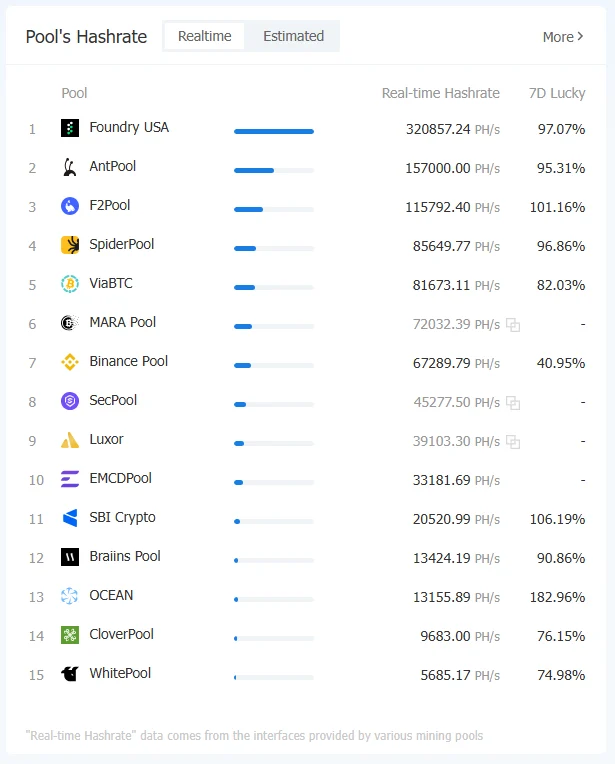
- Miner Wallet Behavior: On-chain analysts will be watching to see if mining pools stop sending coins to exchanges. A cessation of exchange inflows from known mining addresses would be a significant indicator that the miners have stopped liquidating their reserves.
- Volume Profiles: A surge in volume during a move upward—rather than just "short covering" (where traders buy back BTC to close their bearish bets)—would indicate that real, long-term capital is entering the market.
Conclusion
The current discourse surrounding Bitcoin’s production cost and miner stress is a reminder of the unique, market-driven nature of the cryptocurrency ecosystem. Unlike traditional commodities, where production costs are heavily influenced by government regulation and geopolitical intervention, Bitcoin’s supply-side dynamics are entirely algorithmic.
While the current price action near $60,000 is undoubtedly stressful for stakeholders and investors alike, history suggests that such periods of intense pressure are often the crucible in which future bull markets are forged. Whether the market successfully defends this support or faces a deeper correction, the focus for the coming weeks remains clear: observe the miners, respect the liquidity levels, and prepare for the volatility that typically accompanies the final stages of a market cycle.
As always, in the volatile world of digital assets, prudence remains the most valuable asset. The data provided by observers like shabr.eth and technical insights from analysts like Smart_money_Fx serve as vital tools, but they are components of a much larger, global economic puzzle that continues to unfold.