
Bitcoin Teeters Near Production Costs: Miner Stress and Market Resilience at the $60,000 Crossroads
As Bitcoin navigates a precarious dance around the low-$60,000 region, the cryptocurrency market finds itself locked in a familiar yet high-stakes debate. Recent on-chain metrics and technical analyses indicate that the world’s premier digital asset is once again trading near, or even below, its estimated average cost of production. This development has reignited discussions regarding miner capitulation, market cycles, and whether current price levels represent a late-stage bear market floor or the precursor to a much deeper structural downturn.
While production-cost thresholds are notoriously difficult to pin down with absolute precision—varying widely based on hardware efficiency, cooling technology, geographical location, and fluctuating energy tariffs—they remain a vital psychological and economic barometer for the broader crypto ecosystem. When miners are squeezed below profitability, the ripple effects can dictate the trajectory of spot prices for weeks or months.
Simultaneously, technical analysts are eyeing crucial demand zones on the charts, arguing that liquidity sweeps and historical support levels could pave the way for a massive market reversal. Balancing the macro stress of the mining sector against technical resilience, traders are searching for definitive signals to determine whether the bulls or the bears will ultimately command the next major market phase.
Main Facts
The current market dynamic is defined by a convergence of fundamental mining pressures and critical technical support tests:
- Production Cost Threshold: On-chain insights shared by analyst shabr.eth on X indicate that Bitcoin has slipped below its average cost of production. Historically, this phenomenon has coincided with intense miner stress, often observed during the late stages of a bear market cycle rather than at its inception.
- The $60,000–$62,000 Demand Zone: Technical assessments, including a widely circulated TradingView breakdown by analyst Smart_money_Fx, highlight that BTC has retreated from recent highs to test a major historical support zone. A recent sweep of a weak low suggests that institutional or retail liquidity may have been successfully cleared out, allowing price action to test underlying buyer interest.
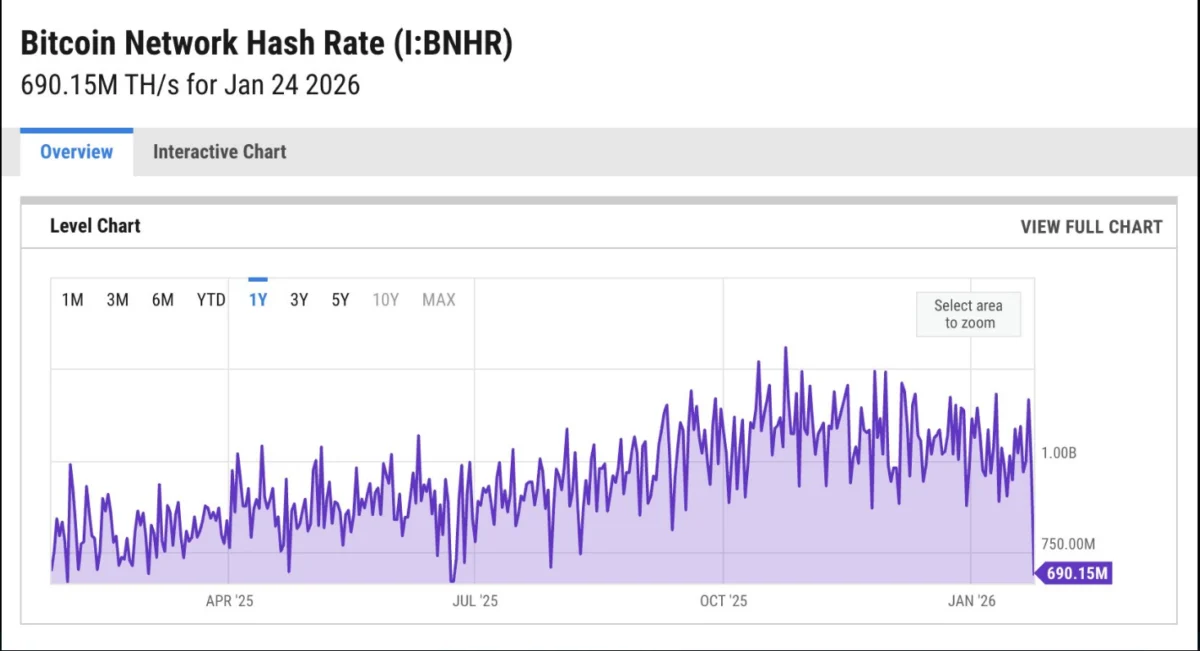
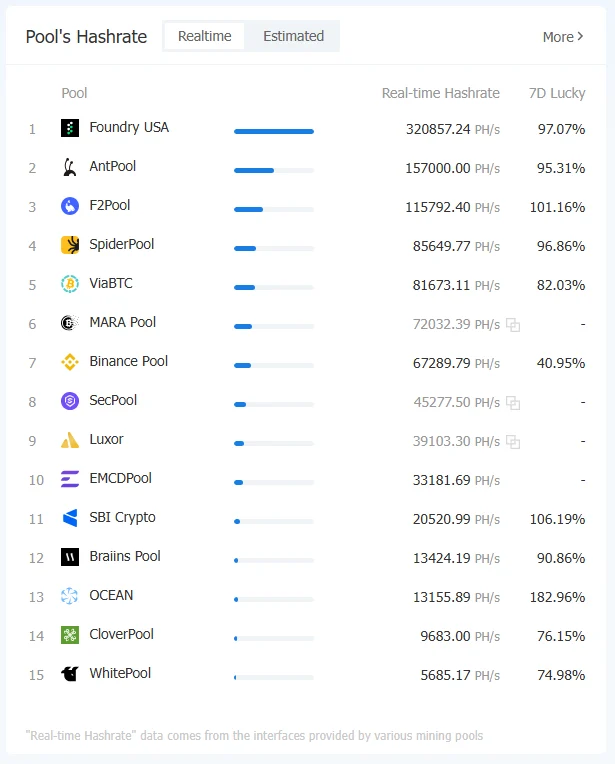
- Miner Vulnerability: When market prices dip below production costs, less efficient mining operations face severe liquidity crunches. This can lead to forced selling of treasury reserves, network hash rate declines, and heightened centralization risks as smaller players power down their rigs.
- Lack of Confirmation: Despite holding key support levels, Bitcoin has yet to confirm a definitive bullish reversal. Analysts emphasize that stopping a fall is not the same as driving a recovery; BTC must reclaim higher local resistance levels and execute a definitive market-structure shift to validate a sustained upward trajectory.
Chronology: How the Current Market Setup Unfolded
To understand how Bitcoin arrived at this critical juncture, it is necessary to examine the chronological progression of price action, macro pressures, and shifting sentiment leading up to June 2026.
The Post-Halving Reality Check
Following the network’s latest halving event, mining rewards were cut in half, instantly compressing profit margins across the board. While a brief post-halving euphoria temporarily buoyed prices, the subsequent consolidation phase exposed structural weaknesses among heavily leveraged mining firms. Companies that had aggressively expanded their infrastructure and purchased next-generation ASIC rigs on credit suddenly found themselves grappling with narrower margins.
The Push Toward Recent Highs
In the months leading up to June, Bitcoin experienced bouts of aggressive volatility, attempting to forge new bullish momentum. However, macroeconomic headwinds, shifting monetary policy expectations, and persistent derivatives leverage capped these rallies. As momentum stalled, spot prices began a methodical slide, shedding gains and retracing toward foundational support structures.
The June 20 Influx of On-Chain Analysis
By June 20, the correction intensified market anxiety as spot values breached the low-$60,000 threshold. It was at this juncture that crypto analyst shabr.eth published findings indicating that Bitcoin was trading beneath its average cost of production. The post immediately went viral across social media platforms, drawing parallels to previous cyclical bottoms where miner capitulation ultimately washed out remaining speculative excess.
Technical Defense at Support
Concurrently, chart analysts zeroed in on the BTCUSD trading pairs on TradingView. As noted by Smart_money_Fx, price action respected a multi-week demand zone situated firmly between $60,000 and $62,000. This area became the focal point for a fierce tug-of-war, with bulls attempting to absorb selling pressure while bears argued that a break below this band would trigger cascading liquidations across both derivative markets and the mining sector.
Supporting Data and On-Chain Metrics
Evaluating the health of the Bitcoin ecosystem requires looking beyond raw price tickers to underlying network data and structural metrics.

The Nuance of Production-Cost Models
Calculating the exact average cost of producing a single Bitcoin is an evolving science. Different research firms utilize proprietary models factoring in:
- Electricity Tariffs: Ranging from subsidized industrial rates in energy-rich regions to higher retail costs paid by smaller operations.
- Hardware Efficiency: The hash-rate-to-power-consumption ratio (Joules per Terahash) of deployed mining equipment, ranging from older S19 models to cutting-edge 3nm and 5nm ASIC miners.
- Network Difficulty: As hash rate fluctuates, mining difficulty adjusts automatically every two weeks, altering the electrical and operational overhead required to mint new coins.
When these variables are aggregated, most models place the global average production cost within striking distance of current spot prices. When the market dips below this benchmark, operational margins turn negative for a significant percentage of the network.
Liquidity Sweeps and Order Book Dynamics
From a technical standpoint, the correction down to the low-$60,000 area served to purge over-leveraged long positions. Order book depth analysis indicates that market makers frequently target these liquidity clusters—areas where stop-losses are heavily concentrated. By sweeping these weak lows, the market efficiently clears resting orders, creating a vacuum that can either fuel a sharp relief rally or expose lower structural supports if buyer demand dries up.
Industry Responses and Expert Perspectives
Market participants, miners, and technical analysts have offered diverse interpretations of what trading below production costs means for the road ahead.
The Bullish Case: Historical Precedent
Optimistic market participants point out that periods of severe miner distress have historically served as reliable macro accumulation zones. When efficient miners weather the storm and inefficient peers capitulate, the network typically experiences a "hash rate flush." Once the weak hands are shaken out and network difficulty adjusts downward, surviving miners enjoy improved profitability margins. Proponents of this view argue that current conditions mirror the final stages of previous bear market consolidation phases, implying that the worst of the downside may already be priced in.
The Bearish Caution: Prolonged Pain
Conversely, cautious analysts warn against blindly treating production-cost metrics as an immediate buy signal. If macroeconomic conditions deteriorate further or if broader financial markets experience a liquidity crunch, Bitcoin could remain depressed below its production cost for an extended period. In such scenarios, forced selling by heavily indebted mining corporations can exert relentless downward pressure on spot prices, deepening the pain for retail investors and delaying the onset of a true bull market.
Implications for Investors and the Broader Crypto Ecosystem
The convergence of miner stress and critical technical support carries profound implications for various participants within the digital asset economy.
For Retail and Institutional Investors
For everyday traders and institutional funds alike, the current price action demands extreme discipline. While buying near major historical support zones offers attractive risk-to-reward ratios, the lack of a confirmed market-structure reversal means downside risks cannot be ignored. Risk management strategies, such as scaling into positions rather than deploying full capital upfront, remain essential. Furthermore, investors must monitor whether spot exchange reserves begin to swell—a classic indicator that miners are transferring newly minted or treasury coins to exchanges for liquidation.
For the Mining Industry
Mining enterprises face an immediate operational crucible. Firms with access to low-cost or renewable energy sources, strong balance sheets, and minimal debt are well-positioned to acquire distressed assets, consolidate market share, and outlast competitors. However, smaller or heavily leveraged operations face existential threats. If prices fail to recover swiftly, expect to see an uptick in corporate restructuring, asset sales, and strategic mergers within the mining sector.
For the Macro Narrative of Bitcoin
Ultimately, this phase tests the decentralized resilience of the Bitcoin network. The protocol is engineered to withstand economic shocks through its automated difficulty adjustments. As miners recalibrate and the market tests the structural integrity of the $60,000 threshold, the outcome will likely define Bitcoin’s trajectory for the remainder of the year—determining whether this cycle is poised for a massive structural reversal or a protracted period of consolidation and economic healing.